Market Update for the Month Ending January 31, 2024

Presented by Mark Gallagher

Quick Hits

  1. Positive Start to the Year
  2. Mixed Month for Bonds
  3. Economic Growth Continues
  4. Update from the Fed
  5. Risks to Monitor
  6. Solid Foundations for the New Year

Positive Start to the Year

It was a solid start to the new year for markets, with all three major U.S. equity indices starting the year in positive territory. The S&P 500 gained 1.68 percent in January while the Dow Jones Industrial Average (DJIA) was up 1.31 percent. The Nasdaq Composite lagged its peers slightly during the month, as the technology-heavy index gained 1.04 percent in January. While the market gains in January were smaller than those in December, this still marked three consecutive months with positive returns for all three indices.

The positive start to the year was supported by improving fundamentals. Per Bloomberg Intelligence as of January 31, with 37 percent of companies having reported actual earnings, the average earnings growth rate for the S&P 500 in the fourth quarter stood at 3.95 percent. This is well above analyst estimates at the start of earnings season for a more modest 1.18 percent increase. These better-than-expected results were widespread, as nine of the 11 sectors reported higher earnings growth than forecast. Over the long run fundamental factors drive market performance, so these positive results are a good sign for investors.

Technical factors were also supportive during the month. All three major U.S. indices ended January above their respective 200-day moving averages. This now marks three straight months with technical support for markets. The 200-day moving average is a widely monitored technical signal, as prolonged breaks above or below this level can signal shifting investor sentiment for an index. The mix of improving fundamentals and continued technical support is an encouraging backdrop for U.S. stocks to start the year.

The story was more mixed internationally. Developed markets held up reasonably well in January, as the MSCI EAFE Index gained 0.58 percent during the month. Emerging markets, though, struggled, with the index down 4.63 percent in January. The weakness in emerging markets was partially due to a continued sell-off in Chinese stocks, as the Shanghai Composite Index was down notably in January. Technical factors were also mixed for international markets in January. The MSCI EAFE Index managed to finish the month above its 200-day moving average for the third consecutive month. The MSCI Emerging Markets Index ended the month below trend after ending December above its 200-day moving average.

Mixed Month for Bonds

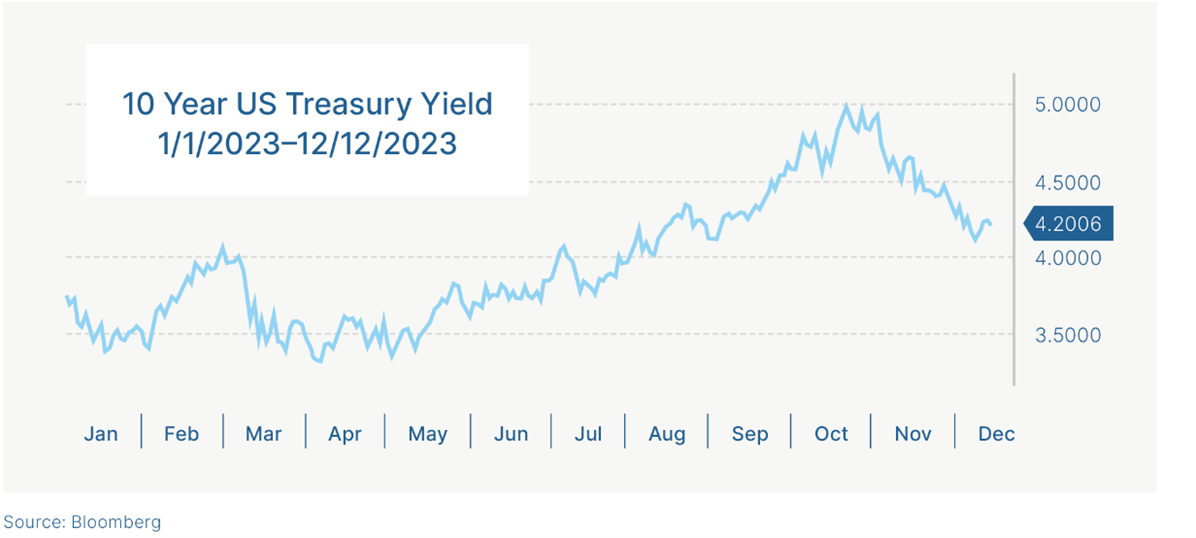
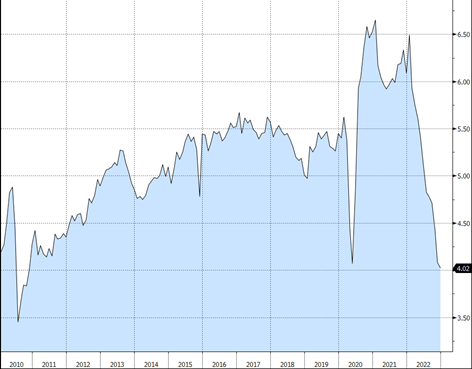
Fixed-income returns were also mixed during the month, as volatile interest rates weighed on bond prices. The 10-year Treasury rate started the month at 3.95 percent and rose as high as 4.18 percent during the month before falling and ending January at 3.99 percent. The Bloomberg Aggregate Bond Index lost 0.27 percent during the month.

High-yield bonds, which are typically less influenced by interest rates, ended January unchanged. The Bloomberg U.S. Corporate High Yield Bond Index gained 0.00 percent during the month. High-yield credit spreads fell from 3.54 percent at the start of January to 3.42 percent by the end of the month. Falling high-yield spreads indicate increased investor optimism and helped support high-yield bond returns to start the year.

Economic Growth Continues

January’s economic updates showed continued signs of growth throughout the economy. This was highlighted by fourth-quarter GDP growth, which came in at a stronger-than-expected 3.3 percent on an annualized basis. This strong economic growth to end the year was supported by healthy job growth, as a better-than-expected 216,000 jobs were added in December. The unemployment rate ended the year at 3.8 percent, signaling continued demand for workers throughout the economy.

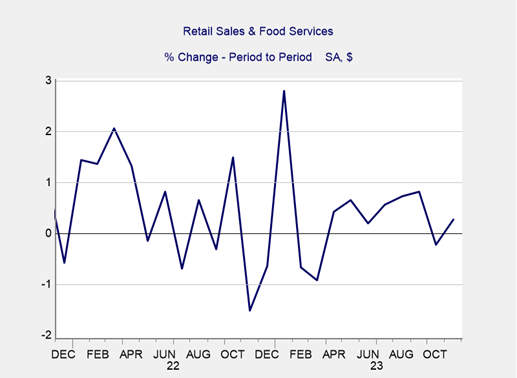
Consumer spending growth also remained strong in December. Retail sales and personal spending growth both improved during the month, with both measures of consumer spending coming in above economist estimates in December. Spending was supported by improved consumer sentiment to end the year, and we saw consumer sentiment increase even more to start January. As you can see in Figure 1, the University of Michigan Consumer Sentiment Index rose to its highest level in more than two years in January, supported by falling inflation expectations and an improved outlook on current economic conditions. Historically improved sentiment has supported faster spending growth, so this is a positive sign for consumer spending in 2024.

Figure 1: University of Michigan Consumer Sentiment, 2010-Present

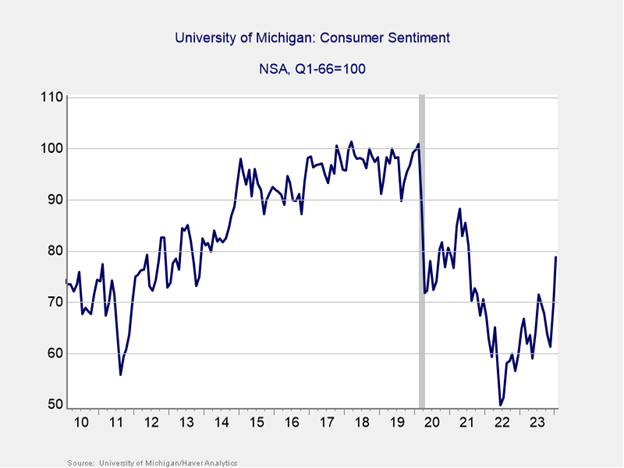
Source: University of Michigan/Haver Analytics 1/19/2024

While the January economic updates largely pointed toward continued growth, they also contributed to still high levels of inflation. Headline consumer prices increased on a year-over-year basis in December, with year-over-year consumer price growth of 3.4 percent coming in above economist estimates for a more modest 3.2 percent increase. While other inflation metrics, such as core consumer prices and producer prices showed signs of softening inflation to end the year, the December inflation reports showed there is still real work to be done to get inflation back to the Federal Reserve’s (Fed’s) 2 percent target.

The Takeaway

– The economy continued to grow toward the end of last year, highlighted by strong job growth and better-than-expected fourth-quarter GDP growth.

– Improved consumer confidence should support spending and economic growth in the new year.

– Consumer inflation remained stubbornly high in December, signaling continued work needed to get price growth back to the Fed’s 2 percent target.

Update from the Fed

We ended the month with an update from the Fed, as the central bank’s first meeting of the year concluded on January 31. The Fed kept interest rates unchanged at this meeting as expected, but provided hints on the future path of interest rates. Fed chair Jerome Powell indicated in his post-meeting press conference that a rate cut at the Fed’s next meeting in March is unlikely, which was at odds with market projections. Markets ended the day down due in part to disappointed investors who were expecting further signs of a cut in March. This disconnect between market expectations and Fed policy contributed to the interest rate volatility that we saw throughout the month.

While markets still expect to see Fed cuts at some point this year, with futures pricing in a 25 basis point cut at the Fed’s May meeting, there is still uncertainty when it come to the timing of the Fed’s first cut. Going forward we’re likely to see short-term volatility surrounding the Fed and interest rates until we receive further clarity on the path forward for monetary policy.

Aside from the Fed, there are also external factors that could impact interest rates and therefore markets that should be monitored.

The Takeaway

– The Fed kept interest rate unchanged at the conclusion of its January meeting.

– Fed chair Jerome Powell indicated that a rate cut is unlikely at the Fed’s next meeting in March, disappointing some investors and contributing to a modest sell-off at month end.

Risks to Monitor

Domestically the major risks for markets remain inflation and the Fed, with the timing of the first rate cut serving as an example of the uncertainty coming from the central bank. Given the importance of the Fed and interest rates for markets, economists and investors will be keeping a close eye on any updates that may provide insight into the future path of monetary policy throughout the course of the year. Political risks remain as well given the election year, which has the potential to lead to increased uncertainty as the election date approaches.

Globally there are several risks to watch for as well. The rising tensions in the Middle East are worth noting, especially given new developments in the Red Sea that may further strain already frayed global supply chains. The ongoing conflict in Ukraine could also flare up at any time, creating the potential for further regional uncertainty. Finally, the continued slowdown in China could have negative impacts across the world given the country’s importance for global growth.

Ultimately there are present risks for markets that should be monitored. Additionally, we may face unforeseen risks throughout the course of the year that could lead to further uncertainty.

The Takeaway

– Real risks remain both domestically and abroad.

– Inflation and the Fed remain the major source of uncertainty for the U.S. with rising tensions in the Middle East serving as a source of international risk.

Solid Foundations for the New Year

Despite the real risks that markets and investors face, we remain in a good place after the first month of the year. The economic and market fundamentals remain sound, with solid economic growth and better than expected earnings growth supporting markets as we head into the new year.

Additionally, while there are real risks that markets face, they are nothing that we haven’t seen before. When it comes to inflation and the Fed we’re closer to the end than the beginning, with continued normalization expected in the months ahead.

While there is still uncertainty surrounding the timing of the Fed’s first cut in 2024, markets and economists expect to see a cut at some point this year, with most projections calling for a May cut. Looking at historical cutting cycles going back to 1982, equity markets tend to rally in the six months following a rate cut, so a cut in May would be a good sign for markets in the second half of the year.

After a very strong 2023, the economic and market momentum has carried into 2024, which should set the stage for another solid year for investors. That said, the potential for short-term setbacks remains. It’s important to remember that a well-diversified portfolio that aligns investor goals with timelines remains the best path forward for most. As always, you should reach out to your financial advisor to discuss your current plan if you have concerns.


Disclosure: This material is intended for informational/educational purposes only and should not be construed as investment advice, a solicitation, or a recommendation to buy or sell any security or investment product. Please contact your financial professional for more information specific to your situation.

Certain sections of this commentary contain forward-looking statements based on our reasonable expectations, estimates, projections, and assumptions. Forward-looking statements are not guarantees of future performance and involve certain risks and uncertainties, which are difficult to predict. Past performance is not indicative of future results. Diversification does not assure a profit or protect against loss in declining markets. All indices are unmanaged and investors cannot invest directly into an index. The Dow Jones Industrial Average is a price-weighted average of 30 actively traded blue-chip stocks. The S&P 500 Index is a broad-based measurement of changes in stock market conditions based on the average performance of 500 widely held common stocks. The Nasdaq Composite Index measures the performance of all issues listed in the Nasdaq Stock Market, except for rights, warrants, units, and convertible debentures. The MSCI EAFE Index is a float-adjusted market capitalization index designed to measure developed market equity performance, excluding the U.S. and Canada. The MSCI Emerging Markets Index is a market capitalization-weighted index composed of companies representative of the market structure of 26 emerging market countries in Europe, Latin America, and the Pacific Basin. It excludes closed markets and those shares in otherwise free markets that are not purchasable by foreigners. The Bloomberg Aggregate Bond Index is an unmanaged market value-weighted index representing securities that are SEC-registered, taxable, and dollar-denominated. It covers the U.S. investment-grade fixed-rate bond market, with index components for a combination of the Bloomberg government and corporate securities, mortgage-backed pass-through securities, and asset-backed securities. The Bloomberg U.S. Corporate High Yield Index covers the USD-denominated, non-investment-grade, fixed-rate, taxable corporate bond market. Securities are classified as high-yield if the middle rating of Moody’s, Fitch, and S&P is Ba1/BB+/BB+ or below. One basis point (bp) is equal to 1/100th of 1 percent, or 0.01 percent.


Mark Gallagher is a financial advisor located at Gallagher Financial Services at 2586 East 7th Ave. Suite #304, North Saint Paul, MN 55109. He offers securities and advisory services as an Investment Adviser Representative of Commonwealth Financial Network®, Member FINRA/SIPC, a Registered Investment Adviser. He can be reached at 651-774-8759 or at mark@markgallagher.com

Authored by the Investment Research team at Commonwealth Financial Network.

© 2024 Commonwealth Financial Network

Quarter Ending December 31, 2023

Presented by Mark Gallagher

Quick Hits

  1. Solid December Caps Strong Year for Markets
  2. Fixed Income Continues to Rally
  3. Economic Updates Show Continued Growth
  4. Focus on the Fed
  5. Risks to Monitor
  6. Positive Outlook for the New Year

Solid December Caps Strong Year for Markets
Markets continued to rally in December, with the positive returns during the month contributing to a strong end to the year. The S&P 500 gained 4.54 percent in December, 11.69 percent in the fourth quarter, and an impressive 26.29 percent over the course of the year. The Dow Jones Industrial Average (DJIA) was up 4.93 percent for the month, 13.09 percent for the quarter, and 16.18 percent for the year. The technology-heavy Nasdaq Composite saw the largest gains with the index up 5.58 percent in December, 13.79 percent during the quarter, and 44.64 percent for the year. Markets were boosted by signs of continued economic growth and falling interest rates at year-end.

Fundamental factors were supportive for markets to end the year. Per Bloomberg Intelligence, the average earnings growth rate for the S&P 500 in the third quarter was 4.48 percent. This was notably better than analyst estimates at the start of earnings season for a 1.22 percent decline in earnings. The better-than-expected results during the quarter were widespread, as earnings growth in most sectors beat expectations. Over the long run fundamentals drive market performance, so the return to solid earnings growth during the quarter was a positive sign for investors.

Technical factors were also supportive during the month, as all three major U.S. indices ended the month well above their respective 200-day moving averages. This now marks two consecutive months with all three indices ending the month above trend. The 200-day moving average is a widely monitored technical signal, as prolonged breaks above or below this level can signal shifting investor sentiment for an index. The combination of improving fundamentals and supportive technicals to end the year are a good sign for U.S. equities as we head into the new year.

The story was much the same internationally, as a year-end rally helped support solid performance for international stocks over the quarter and year. The MSCI EAFE Index gained 5.31 percent in December, 10.42 percent during the quarter, and a solid 18.24 percent throughout the course of the year. The MSCI Emerging Markets Index gained 3.95 percent in December, 7.93 percent for the quarter, and 10.27 percent for the year. Technical factors were supportive for international stocks to end the year, with both the MSCI EAFE and MSCI Emerging Markets indices finishing the month above trend. This now marks two straight months with continued technical support for foreign stocks after a three-month stretch from August through October where both indices fell below their respective trendlines.

Fixed Income Continues to Rally
Fixed income markets continued to rally to end the year, supported by falling interest rates. The 10-year U.S. Treasury Yield fell from 4.37 percent at the end of November to 3.88 percent at the end of December. Short-term rates fell as well, with the two-year Treasury yield dropping from 4.73 percent at the end of November to 4.23 percent to end the year. The Bloomberg Aggregate Bond Index gained 3.83 percent for the month and 6.82 percent for the quarter. The strong fourth quarter helped offset earlier weakness for the index, which finished the year with a 5.53 percent return.

High-yield fixed income also performed well to end the year. The Bloomberg U.S. Corporate High Yield Index gained 3.73 percent for the month, 7.16 percent for the quarter, and 13.45 percent throughout the course of the year. High-yield credit spreads ended the year at 3.32 percent, which was well below the 2023 high of 5.22 percent we saw in March and the 3.84 percent level at the end of November. The fall in credit spreads to close the year indicates that investors ended the year with a rising appetite for riskier, high-yield securities.

Economic Updates Show Continued Growth
The economic updates released in December painted a picture of continued economic growth to end the year. Hiring accelerated in November, with a better-than-expected 199,000 jobs added during the month. We also saw a rebound in consumer confidence in December, as increased consumer optimism caused both major measures of consumer sentiment to end the year at multi-month highs.

The improved consumer sentiment was due in part to further progress in the fight against inflation. Headline consumer inflation fell to 3.1 percent on a year-over-year basis in November, well below the recent high of 9.1 percent that we saw in June 2022. While there is still work to be done to get inflation back down to the Federal Reserve’s 2 percent target, the improvement we’ve seen over the past two years is an encouraging sign that we are heading in the right direction. Consumers responded to the falling inflation figures by lowering their inflation expectations, which in turn helped support the rise in sentiment at year-end.

The improving confidence was an encouraging sign as historically higher levels of confidence have supported faster spending growth. Speaking of spending growth, retail sales and personal spending both improved in November, which is a good sign for sales during the busy holiday season. As you can see in Figure 1 below, the 0.3 percent rise in retail sales in November represented a rebound following a surprising drop in sales in October.

Figure 1: Retail Sales & Food Services, December 2020–Present

Given the importance of consumer spending on the overall economy, the return to spending growth, and improved confidence at year-end are a positive signal for the economy as we kick off the new year.

The Takeaway

– There are signs of continued economic growth at year-end.

– Improved consumer confidence should support spending and economic growth in the new year.

Focus on the Fed
With inflation continuing to show signs of improvement and markets rallying on the news, one of the major question marks as we enter 2024 is what the Fed has planned for monetary policy throughout the course of the year. The Fed kept interest rates unchanged at its December meeting and Fed chair Jerome Powell indicated in his post-meeting press conference that the central bankers were considering cutting interest rates in 2024. He did indicate that the timing for any future cuts will remain dependent on developments in the economic data.

We ended the year with markets pricing in a total of six interest rate cuts throughout 2024. Fed members on the other hand ended the year projecting a median of three interest rate cuts in 2024. This disconnect between Fed and market rate expectations will be worth monitoring in the months ahead, as it could represent a risk to markets if investors overestimate the Fed’s willingness to cut rates throughout the course of the year.

Any talk of rate cuts will be dependent on how inflation and the economy develop in 2024. While the most likely path forward is for continued modest improvement in the months ahead, we could still see inflation reaccelerate, which in turn could lead to delayed rate cuts or even rate hikes at future Fed meetings. While the progress we’ve made so far in combating inflationary pressure has been impressive, we’re not in the clear when it comes to inflation and the Fed.

The Takeaway

– Despite positive progress in combating inflation, questions on the path of monetary policy in 2024 remain.

– The Fed and inflation will continue to present a risk to markets in 2024.

Risks to Monitor
While the Fed and inflation remain the most immediate risks, there are other risks to markets and the economy. Domestically, the U.S. elections in November are approaching and could lead to uncertainty in the second half of the year.

International risks remain as well, highlighted by ongoing wars in Europe and the Middle East. While the immediate market impact from the current conflicts has been muted, we could see an escalation that could lead to further instability in the regions. International shipping and supply lines may be especially vulnerable to rising tension in the Middle East and this will be an important area to monitor in the months ahead given the importance of international trade in the fight against inflation.

Finally, we also have unknown risks that could negatively impact markets. At this time last year few investors were talking about weakness in the U.S. banking industry or a potential government default, both of which caused brief bouts of market turbulence in 2023.

The Takeaway

– Market and economic risks remain, with inflation and the 2024 elections serving as the primary risks domestically.

– International concerns remain, which should be monitored.

Positive Outlook for the New Year
Despite the real risks that remain for markets and the economy, the overall outlook remains positive as we head into the new year. Market fundamentals and technicals ended the year on a high note with a return to earnings growth and solid technical support toward year-end. Additionally, economic fundamentals continue to show signs of a healthy, expanding economy which should set the stage for continued market gains in 2024.

Consumer spending remained impressively resilient throughout most of 2023 and improved consumer confidence at year-end should support continued spending in 2024. Business confidence and spending also showed signs of solid growth to end the year. Looking forward, we appear poised for continued positive economic and market performance in the months ahead.

There are real risks to this outlook that remain. Inflation, the Fed, and rising geopolitical risk remain front of mind as we head into the new year but other risks may develop as well.

It’s important to remember that even in strong years for markets, investors can face a bumpy ride along the way. Going back to 1980, the average intra-year price decline (the average annual price decline from peak-to-trough during the year) for the S&P 500 was 14.2 percent, while the average annual return was 9 percent. This means that even though the S&P 500 averaged high single-digit annual returns over this time, periods with selloffs were a common feature almost every year. This was true in 2023, as the S&P 500 fell by 10 percent from peak-to-trough during the year but ended the year up more than 26 percent on a total return basis.

Given the history of volatility for equity markets and the potential for short-term uncertainty due to the risks markets face, a well-diversified portfolio constructed to withstand bouts of market turbulence remains the best path forward for most investors. If concerns remain, you should reach out to your financial advisor to discuss your financial plans.


Disclosure: Certain sections of this commentary contain forward-looking statements based on our reasonable expectations, estimates, projections, and assumptions. Forward-looking statements are not guarantees of future performance and involve certain risks and uncertainties, which are difficult to predict. Past performance is not indicative of future results. Diversification does not assure a profit or protect against loss in declining markets. All indices are unmanaged and investors cannot invest directly into an index. The Dow Jones Industrial Average is a price-weighted average of 30 actively traded blue-chip stocks. The S&P 500 Index is a broad-based measurement of changes in stock market conditions based on the average performance of 500 widely held common stocks. The Nasdaq Composite Index measures the performance of all issues listed in the Nasdaq Stock Market, except for rights, warrants, units, and convertible debentures. The MSCI EAFE Index is a float-adjusted market capitalization index designed to measure developed market equity performance, excluding the U.S. and Canada. The MSCI Emerging Markets Index is a market capitalization-weighted index composed of companies representative of the market structure of 26 emerging market countries in Europe, Latin America, and the Pacific Basin. It excludes closed markets and those shares in otherwise free markets that are not purchasable by foreigners. The Bloomberg Aggregate Bond Index is an unmanaged market value-weighted index representing securities that are SEC-registered, taxable, and dollar-denominated. It covers the U.S. investment-grade fixed-rate bond market, with index components for a combination of the Bloomberg government and corporate securities, mortgage-backed pass-through securities, and asset-backed securities. The Bloomberg U.S. Corporate High Yield Index covers the USD-denominated, non-investment-grade, fixed-rate, taxable corporate bond market. Securities are classified as high-yield if the middle rating of Moody’s, Fitch, and S&P is Ba1/BB+/BB+ or below.


Mark Gallagher is a financial advisor located at Gallagher Financial Services at 2586 East 7th Ave. Suite #304, North Saint Paul, MN 55109. He offers securities and advisory services as an Investment Adviser Representative of Commonwealth Financial Network®, Member FINRA/SIPC, a Registered Investment Adviser. He can be reached at 651-774-8759 or at mark@markgallagher.com

Authored by the Investment Research team at Commonwealth Financial Network.

© 2024 Commonwealth Financial Network


A Look Ahead to 2024

Presented by Mark Gallagher

At the start of 2023, we saw dire headlines about the economy and the markets despite positive economic data. Ultimately, the results this year followed the data, not the headlines. Yes, there were (and are) many concerns and risks. As long as the data stays solid, however, so should the results. And that’s worth keeping in mind looking ahead to 2024, too. Although we see some economic slowing, fundamentals remain sound—and that should support the markets.

So, what does 2024 hold? If you look at headlines, you see a recession, high inflation, trouble abroad, and a market at serious risk. But if you look at the data, the picture is much brighter. Americans are getting jobs and earning more money. Businesses are investing in people, buildings, and equipment. Companies are expected to earn more money next year than this year, driven by sustained consumer spending. In other words, the data says the expansion continues. And, again, if we’re choosing to believe the headlines or the data, the latter is more trustworthy.

2024 Year-End Expectations

A Solid Economic Foundation

Analyzing the economy is simple: people earn and spend money, and businesses hire and invest to support that spending. As long as both pieces are in place, as they are currently, the foundation is solid. Job growth, in particular, remains healthy. Although we’ve seen a slowdown in the employment market, it decreased from extremely high levels and is approaching normal. This normalization is a good thing because it should help keep inflation contained. Similarly, we’ve seen a pullback in consumer confidence to levels typical of the mid-2010s, and business investment has slowed to more typical levels as well. All reflect a return to normal, which is a good thing.

One reason this is positive: a normal economy should generate more normal levels of inflation. That is what we’ve seen in 2023 and what we expect to continue in 2024. Inflation has dropped significantly this year and should continue to do so for the next several months. With housing, we know values have been slowing and rents declining, and that will show up in inflation numbers over the next several months. We also see moderating wage and spending growth. Overall, these slowing trends should continue bringing inflation down into early next year.

Interest Rates and Their Impact

With inflation decreasing, we should see interest rates start to pull back from current levels. Although we likely won’t see a significant decline, we also shouldn’t see rates continue to move higher. As inflationary pressures ease, and with longer-term rates much higher than they were at the start of the year, 2024 should also see tighter financial conditions. This is already slowing growth and making further rate hikes by the Federal Reserve (Fed) unnecessary. The interest rate risk is now much lower than it has been—and it should decline even further in the coming year. We may even see rate cuts in 2024, which could spark financial markets again. Overall, policy risks for 2024 are much lower than they were in 2023.

Earnings have come in above expectations for the third quarter of 2023 and are expected to keep improving through next year. A combination of a growing economy, a surprising level of recent productivity growth, and a steadying financial environment is allowing companies to sell more and improve operations, which is showing up on the bottom line. Rising earnings allow stock prices to climb even in a difficult financial environment, which is undoubtedly a good thing.

And, though we have experienced a difficult financial environment, recent signs indicate it may be easing as rates pull back. Higher rates mean lower valuations, which has been the main driver behind recent stock market declines. As rates moderate, or even pull back a bit, there is an opportunity for markets to rise even further on higher valuations.

Risks and Opportunities Ahead

Of course, we could see the economy slow even further, which would put many of these gains at risk. More political dysfunction in the U.S. (remember, 2024 is a presidential election year) could derail the expansion. A wider war in Europe or the Middle East could do the same. If inflation comes back, we will certainly see higher rates, which will affect everything. So, there are real risks.

But the same was true at the start of 2023. We saw political dysfunction, a Middle East war, and rapidly rising interest rates—yet we still did okay. There are many risks baked into the economy and markets right now, so things don’t have to go perfectly for us to see real opportunities; they just have to go better than expected. In that sense, it’s a good thing expectations are low.

A Positive Outlook for 2024

There’s no doubt real risks remain. But that’s always been the case, and 2024 will likely be no different. Here in the U.S., we are relatively isolated from many of the world’s problems and can continue to grow regardless. With the labor market healthy, businesses continuing to expand, and inflation coming under control, the economy and the markets can still fare well despite the problems. Pay attention to the risks but keep an eye on the opportunities. It worked in 2023 and is likely to work in 2024, too.


Certain sections of this commentary contain forward-looking statements that are based on our reasonable expectations, estimates, projections, and assumptions. Forward-looking statements are not guarantees of future performance and involve certain risks and uncertainties, which are difficult to predict. Investments are subject to risk, including the loss of principal. Past performance is no guarantee of future results. This material is intended for informational/educational purposes only and should not be construed as investment advice, a solicitation, or a recommendation to buy or sell any security or investment product.

Authored by Brad McMillan, CFA®, managing principal, chief investment officer, at Commonwealth Financial Network®.

Mark Gallagher is a financial advisor located at Gallagher Financial Services at 2586 East 7th Ave. Suite #304, North Saint Paul, MN 55109. He offers securities and advisory services as an Investment Adviser Representative of Commonwealth Financial Network®, Member FINRA/SIPC, a Registered Investment Adviser. He can be reached at 651-774-8759 or at mark@markgallagher.com

© 2024 Commonwealth Financial Network


Market Update for the Month Ending January 31, 2023

Presented by Mark Gallagher

Markets Rebound in January

Markets rallied to start the year, with all three major U.S. indices seeing positive returns in January after experiencing declines in 2022. The S&P 500 rose 6.28 percent, the Dow Jones Industrial Average rose 2.93 percent, and the technology-heavy Nasdaq Composite led the way with a strong 10.72 percent gain. Equity markets were supported by falling long-term interest rates.

These positive returns came despite weakening fundamentals. Per Bloomberg Intelligence, as of January 31, 2023, with 45 percent of companies having reported actual earnings, the average earnings decline for the S&P 500 in the fourth quarter of 2022 was 2.3 percent. Although this is slightly better than the 3.3 percent decline forecasted at the start of earnings season, if earnings decline for the fourth quarter, it would represent the first quarter with a year-over-year decline since the third quarter of 2020. Analysts are currently forecasting continued earnings declines in the first half of 2023 as well. Fundamentals drive long-term market performance, so the weakness in earnings should be monitored.

While fundamentals were not supportive, technical factors were another story. All three major U.S. indices ended the month above their respective 200-day moving averages, which marked the first month that all three have finished above trend since December 2021. The 200-day moving average is a widely monitored technical indicator, as prolonged breaks above or below trend can signal shifting investor sentiment for an index. Although a one-month trend is not enough to say that investors are now bullish on U.S. equities, technical support to start the year was still an encouraging sign for investors.

The story was similar with international markets in January. The MSCI EAFE Index of developed international companies gained 8.10 percent while the MSCI Emerging Markets Index increased 7.91 percent. Falling interest rates and reopening efforts in China helped support international stocks to start the year. Technical factors were also supportive during the month, as both the developed and emerging market indices finished the month above their respective 200-day moving averages. This represents the first time that the MSCI Emerging Markets Index has finished a month above trend since June 2021.

Bond markets also had a strong start to the year. Long-term rates fell in January, as the 10-Year U.S. Treasury yield declined from 3.88 percent at the end of December to 3.52 percent at the end of January. This helped support bond prices as the Bloomberg U.S. Aggregate Bond Index gained 3.08 percent. High-yield bonds were also up to start the year. The Bloomberg U.S. Corporate High Yield Bond Index gained 3.81 percent in January. High-yield credit spreads tightened, which indicates that investors grew more comfortable with taking on additional credit risk at lower yields.

Falling Rates Support Markets

The solid start to the year for investors was due in large part to declining interest rates during the month. The drop in rates was in turn driven by signs of slowing inflation and expectations for slower rate hikes this year. Headline producer and consumer prices both declined in December, with the monthly drop in prices supporting slowing year-over-year price growth. Inflation is high on a year-over-year basis, but the December price reports showed encouraging signs of declining price pressure across the economy. Economist and consumer forecasts call for continued slowing inflation throughout the year, which is another positive sign that efforts to contain price growth are paying off.

Cooling inflation helped support increased investor expectations for a slowdown in the pace of Federal Reserve (Fed) rate hikes in 2023 compared to 2022. Futures markets project one additional 25 basis point (bp) hike this year following the 25 bps hike in February and the 4.25 percent of rate hikes we saw in 2022. If expectations prove to be accurate, it would represent a notable slowdown in the pace of rate hikes.

Economic Growth Slows

While the slowdown in inflation was a good sign for the economy and investors, other economic data reports released during the month showed signs of a continued economic slowdown. Consumer spending fell for the second consecutive month to end 2022, and business confidence and investment also slowed at year-end. Given the signs of economic slowdown, it’s possible that we’ll enter a recessionary environment at some point this year. That said, if we do see a recession in 2023, it’s expected to be mild.

Job growth remained strong at the end of 2022, which should help support the economy in the case of a potential recession. Consumer confidence also showed signs of improvement toward the end of last year and start of this year. The University of Michigan consumer sentiment index finished January at its highest level since April 2022, signaling increased consumer optimism to start the year. Improved consumer sentiment has historically supported consumer spending growth, so this confidence is another encouraging signal that economic fundamentals are relatively healthy despite the recent slowdown.

Additionally, a further slowdown in economic growth could encourage the Fed to keep rate hikes this year to a minimum, which would again support markets. Ultimately, while no one roots for a recession, relatively healthy economic fundamentals indicate that a recession in 2023 would likely be mild and could benefit investors and the economy in the long run.

One sector that’s seen a notable slowdown already is the housing sector. Housing sales continued to fall at year-end, due to high prices and mortgage rates along with a lack of supply of homes for sale. As you can see in Figure 1, the annualized pace of existing home sales fell throughout the course of last year, with the December result bringing the pace of sales to its lowest level since 2010. The housing sector will be important to monitor going forward as housing costs make up a large portion of consumer inflation. The slowdown in housing sales has been challenging for prospective home sellers over the past year. We started to see signs of declining housing prices toward year-end, however, which could help support slower inflation later this year if the trend continues.

Figure 1. Total Existing Home Sales, Seasonally Adjusted Annualized Rate, 2010–Present

Risks Remain

It was a positive start to the year for investors, but there are very real market risks to monitor. The primary risk here in the U.S. is political, as the debt ceiling confrontation is set to drive uncertainty for markets and the economy until it’s resolved. While we’ve seen similar standoffs in the past that have been resolved before a potential government default, this process could play out over the course of several months and markets would likely face additional volatility if a compromise cannot be reached in a timely manner. Investors will also be keeping an eye on equity fundamentals given the expected earnings decline in the fourth quarter and analyst forecasts for continued earnings declines in the first half of 2023.

International risks should also be monitored as uncertainty overseas remains. Even though the direct market impact from the Russian invasion of Ukraine declined throughout 2022, the continued conflict could lead to further flare ups and uncertainty for the region and investors. Additionally, China’s efforts to reopen its economy bear watching, as any slowdown in the reopening process could spook investors.

It’s also important to remember that other risks might materialize and negatively impact markets at any time. Last year was a good example of the impact that unknown risks present, as the Russian invasion of Ukraine and the surge in inflation year drove investors across asset classes into the red. The market impact from those risks diminished but serve as a reminder that we may see further turbulence ahead.

Ultimately, there are a number of risks for investors as we kick off 2023. On the whole, however, the picture is relatively positive. While there is certainly the potential for short-term market turbulence in the months ahead, the relatively solid economic backdrop should help support long-term performance. Given the prospects for more short-term uncertainty, a well-diversified portfolio that matches investor goals with timelines remains the best path forward for most. As always, you should reach out to your financial advisor to discuss your current plan if you have concerns.

All information according to Bloomberg, unless stated otherwise.

Disclosure: Certain sections of this commentary contain forward-looking statements based on our reasonable expectations, estimates, projections, and assumptions. Forward-looking statements are not guarantees of future performance and involve certain risks and uncertainties, which are difficult to predict. Past performance is not indicative of future results. Diversification does not assure a profit or protect against loss in declining markets. All indices are unmanaged and investors cannot invest directly into an index. The Dow Jones Industrial Average is a price-weighted average of 30 actively traded blue-chip stocks. The S&P 500 Index is a broad-based measurement of changes in stock market conditions based on the average performance of 500 widely held common stocks. The Nasdaq Composite Index measures the performance of all issues listed in the Nasdaq Stock Market, except for rights, warrants, units, and convertible debentures. The MSCI EAFE Index is a float-adjusted market capitalization index designed to measure developed market equity performance, excluding the U.S. and Canada. The MSCI Emerging Markets Index is a market capitalization-weighted index composed of companies representative of the market structure of 26 emerging market countries in Europe, Latin America, and the Pacific Basin. It excludes closed markets and those shares in otherwise free markets that are not purchasable by foreigners. The Bloomberg Aggregate Bond Index is an unmanaged market value-weighted index representing securities that are SEC-registered, taxable, and dollar-denominated. It covers the U.S. investment-grade fixed-rate bond market, with index components for a combination of the Bloomberg government and corporate securities, mortgage-backed pass-through securities, and asset-backed securities. The Bloomberg U.S. Corporate High Yield Index covers the USD-denominated, non-investment-grade, fixed-rate, taxable corporate bond market. Securities are classified as high-yield if the middle rating of Moody’s, Fitch, and S&P is Ba1/BB+/BB+ or below.

Mark Gallagher is a financial advisor located at Gallagher Financial Services at 2586 East 7th Ave. Suite #304, North Saint Paul, MN 55109. He offers securities and advisory services as an Investment Adviser Representative of Commonwealth Financial Network®, Member FINRA/SIPC, a Registered Investment Adviser. He can be reached at 651-774-8759 or at mark@markgallagher.com

Authored by Brad McMillan, CFA®, CAIA, MAI, managing principal, chief investment officer, and Sam Millette, manager, fixed income, at Commonwealth Financial Network®.

© 2023 Commonwealth Financial Network®