Presented by Mark Gallagher
Mixed returns in June cap strong second quarter
U.S. markets led the way in June. Large-cap equities did well even as technology stocks ran into turbulence. The Dow Jones Industrial Average and S&P 500 Index posted solid gains of 1.74 percent and 0.62 percent, respectively. But the Nasdaq suffered from weakness in technology and finished the month down 0.87 percent.
Quarterly results were better. The S&P 500 was up 3.09 percent, and the Dow gained 3.95 percent. Despite its slight pullback in June, the Nasdaq did best, climbing 4.16 percent. Year-to-date, the Dow and S&P 500 have risen a strong 9.34 percent and 9.35 percent, and the Nasdaq has gained an impressive 14.71 percent. The three indices remain strong on a technical basis as well. All remained above their 200-day moving averages for the quarter, ending the first half of 2017 near all-time highs.
Earnings growth continues to support the stock market. After strong earnings growth in the first quarter, the second quarter looks good, too. According to FactSet, as of June 30, the S&P 500’s estimated earnings growth rate for the second quarter is 6.6 percent. This figure is slightly lower than the number anticipated at the end of the first quarter but may be good enough to drive stocks higher. Analysts expect nine sectors to show earnings growth.
International equity markets experienced a similar month and quarter. The MSCI EAFE Index, which represents the stocks of developed markets, declined 0.18 percent in June. But it managed a total return of 6.12 percent for the quarter. The MSCI Emerging Markets Index fared better, posting a 1.07-percent return for the month and a 6.38-percent gain for the quarter. Year-to-date, the EAFE is up 13.81 percent, and emerging markets have soared 18.60 percent. Technicals have been healthy for the two major international indices as well. Both remained above their trend lines for the month and quarter.
The renewed earnings growth and a supportive economic environment have driven the strong market performance year-to-date. The current synchronized global economic expansion is the first since the financial crisis, and it should continue to support faster growth.
Results for fixed income markets were mixed. The Federal Reserve (Fed) interest rate increase—though expected—forced market adjustments. The Bloomberg Barclays Aggregate Bond Index declined 0.10 percent in June, as the rate on the 10-year Treasury rose from 2.21 percent at the beginning of June to 2.31 percent by month-end. Longer-term results were better. The index returned 1.45 percent for the second quarter and is up 2.27 percent year-to-date.
The Bloomberg Barclays U.S. Corporate High Yield Index performed better for the month, gaining 0.14 percent in June and 2.17 percent for the quarter. The high-yield market remains popular; spreads are near post-recession lows, supporting returns. Default rates are still below historical average levels.
Economic data supports growth
First-quarter gross domestic product growth (GDP) was stronger than the initial estimate. The figure was revised upward, to 1.4 percent, which is double the original 0.7-percent estimated rate.
Positive revisions to consumer consumption numbers were the major drivers of the improved GDP rate. Consumption rose from an initial estimate of 0.3-percent growth to a robust 1.1-percent increase. The revisions, as well as the recent trend of weak first quarters to be followed by stronger subsequent quarters, represent a good start to the year.
Second-quarter data is also looking positive. Consumer income and spending rose 0.4 percent in April, and the figures for March were revised upward. Solid job and wage growth engendered the good results.
Data toward the end of June was less positive. Income growth has been strong, but spending growth has declined to 0.1 percent. This is actually better than it looks. The drop was due to lower gas prices—an overall positive—and moderating auto sales, which is a continued adjustment down from very strong previous sales levels. Combined with the decline in inflation, these factors seem to indicate that the decrease in spending may not be a concern yet.
The May jobs report was also weak, with only 138,000 jobs created. This figure was well below expectations, although the unemployment rate fell to its lowest level in 16 years. The slowing pace of job growth may be due to a lack of qualified job seekers, not a lack of jobs. Indicators point to job growth picking up; so, again, this situation is not yet a concern.
Despite some weak data, the Fed remains positive about the outlook for the economy. It raised the federal funds rate 25 basis points at its June meeting. The increase was anticipated and largely interpreted as a sign of continued confidence.
Housing rebounds following a weak April
Perhaps the most encouraging data for the quarter came from the housing sector. Some results for May were stronger-than-expected and offset a slight slowdown in April. Existing home sales in May were up 1.1 percent, though analysts had forecast a decline. New home sales also increased by more than expected for the month. The upticks were notable given the low level of supply on the market—existing housing stock is at its lowest level since 1982. Supply is expected to remain tight.
Home builder confidence dropped unexpectedly in May, as did housing starts and building permits. These declines were of some concern—especially given the low levels of housing supply. They could indicate that building costs are increasing.
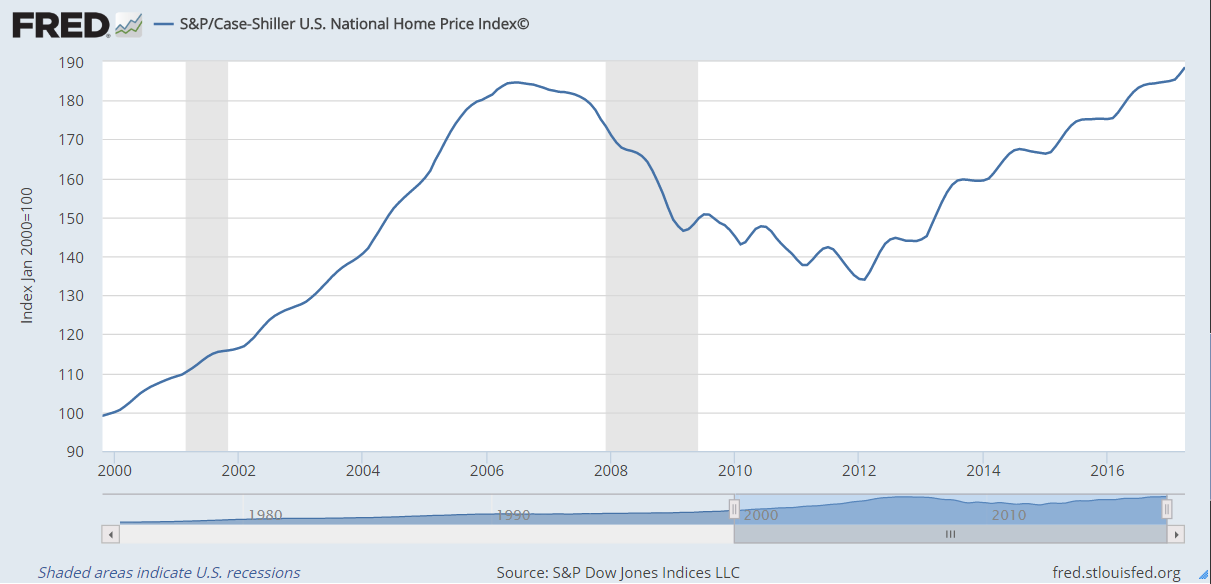
Healthy demand drove the strength in housing. The S&P/Case-Shiller U.S. National Home Price Index showed that home prices had surpassed pre-recession highs (see Figure 1). Sales have continued to increase despite all-time highs in prices. This signals that many consumers are confident enough in the economy to make a long-term investment.
Figure 1. S&P Case-Shiller U.S. National Home Price Index, 2000−2017
Business and consumer sentiment still strong
The largely positive hard data reported in June was bolstered by continued strength in business and consumer sentiment. Business confidence remained high in May. This was reflected in the surprise increase in the ISM Manufacturing Index, which analysts had expected to remain flat.
Core durable goods orders, which are a proxy for business confidence, increased slightly during May. And although the ISM Non-Manufacturing Index was down for the same period, this measure is still in healthy expansionary territory.
Consumer confidence is still high, despite a small pullback in some surveys in June. The Conference Board Consumer Confidence Survey declined slightly, yet its three-month average is at the highest level since 2001. The high levels of confidence are providing a solid tailwind for continued growth.
Political risks remain
As has been the case for much of the year, politics continue to add uncertainty to the markets. The major domestic concern has been the Republican effort to reform heath care. To add to the uncertainty, the fate of wide-ranging tax reform is partially tied to the success of the administration’s health care efforts. Republican lawmakers are looking to use savings from health care reform to offset potential revenue losses from corporate and personal tax cuts. At this point, expectations are low, so the downside risk is probably low as well. There may be some upside potential if Congress is able to move forward.
Internationally, political risks remain. But given the better-than-expected results from recent European elections, these seem less pressing than earlier in the year. Progress has been made in dealing with economic issues. For example, the Italian banking system has started to resolve some of its problems. Market volatility could still arise from upcoming Italian election results and a worsening of the situation with North Korea.
Strong first half is a good sign for the rest of 2017
Risks remain and there have been signs of slowing growth, but the outlook for the U.S. economy is positive. High levels of confidence combined with increasing income and spending bode well for second-half growth. And, as growth speeds up in the rest of the world, the U.S. should benefit.
The positive outlook notwithstanding, we are bound to see volatility in the short and intermediate terms. A well-balanced portfolio designed to match objectives and hedge against the inevitability of less positive conditions in the future remains the best means to achieve financial goals.
All information according to Bloomberg, unless stated otherwise.
Disclosure: Certain sections of this commentary contain forward-looking statements based on our reasonable expectations, estimates, projections, and assumptions. Forward-looking statements are not guarantees of future performance and involve certain risks and uncertainties, which are difficult to predict. Past performance is not indicative of future results. Diversification does not assure a profit or protect against loss in declining markets. All indices are unmanaged and investors cannot invest directly into an index. The Dow Jones Industrial Average is a price-weighted average of 30 actively traded blue-chip stocks. The S&P 500 Index is a broad-based measurement of changes in stock market conditions based on the average performance of 500 widely held common stocks. The Nasdaq Composite Index measures the performance of all issues listed in the Nasdaq Stock Market, except for rights, warrants, units, and convertible debentures. The MSCI EAFE Index is a float-adjusted market capitalization index designed to measure developed market equity performance, excluding the U.S. and Canada. The MSCI Emerging Markets Index is a market capitalization-weighted index composed of companies representative of the market structure of 26 emerging market countries in Europe, Latin America, and the Pacific Basin. It excludes closed markets and those shares in otherwise free markets that are not purchasable by foreigners. The Bloomberg Barclays Aggregate Bond Index is an unmanaged market value-weighted index representing securities that are SEC-registered, taxable, and dollar-denominated. It covers the U.S. investment-grade fixed-rate bond market, with index components for a combination of the Bloomberg Barclays government and corporate securities, mortgage-backed pass-through securities, and asset-backed securities. The Bloomberg Barclays U.S. Corporate High Yield Index covers the USD-denominated, non-investment-grade, fixed-rate, taxable corporate bond market. Securities are classified as high-yield if the middle rating of Moody’s, Fitch, and S&P is Ba1/BB+/BB+ or below.
###
Mark Gallagher is a financial advisor located at Gallagher Financial Services at 2586 East 7th Ave. Suite #304, North Saint Paul, MN 55109. He offers securities and advisory services as an Investment Adviser Representative of Commonwealth Financial Network®, Member FINRA/SIPC, a Registered Investment Adviser. He can be reached at 651-774-8759 or at mark@markgallagher.com.
Authored by Brad McMillan, senior vice president, chief investment officer, and Sam Millette, fixed income analyst, at Commonwealth Financial Network®.
© 2017 Commonwealth Financial Network®