Presented by Mark Gallagher
Solid December caps strong year for markets
All three major U.S. indices were up during the last month and quarter of 2017. In December, the Dow Jones Industrial Average returned 1.92 percent, while the S&P 500 and Nasdaq Composite indices gained 1.11 percent and 0.48 percent, respectively. For the quarter, the Dow gained 10.96 percent; the S&P 500, 6.64 percent; and the Nasdaq, 6.55 percent. For the year, the Nasdaq rose an impressive 29.64 percent, with the Dow climbing 28.11 percent and the S&P 500 returning 21.83 percent. All three indices were trading above their 200-day moving averages at year-end.
Improving earnings largely drove the positive performance. Per FactSet, at year-end, estimated fourth-quarter earnings growth for the S&P 500 was 10.9 percent, with all 11 sectors projected to grow from third-quarter levels.
International markets also had a successful year. The MSCI EAFE Index of developed markets gained 1.61 percent, 4.23 percent, and 25.03 percent for the month, quarter, and year, respectively. The MSCI Emerging Markets Index returned 3.64 percent in December, 7.50 percent for the quarter, and 37.75 percent for the year. International markets closed 2017 with strong technical support.
The Federal Reserve increased the federal funds rate three times in 2017, demonstrating confidence in the economic expansion. Markets anticipate two or three rate increases in 2018.
Despite the rate hikes, the Bloomberg Barclays Aggregate Bond Index was up 0.46 percent in December, bringing the quarterly return to 0.39 percent and capping the annual return at 3.54 percent. The Bloomberg Barclays U.S. Corporate High Yield Index rose 0.30 percent and 0.47 percent for the month and quarter, though a stronger start to 2017 led to a 7.50-percent annual return.
Consumers drive economic growth
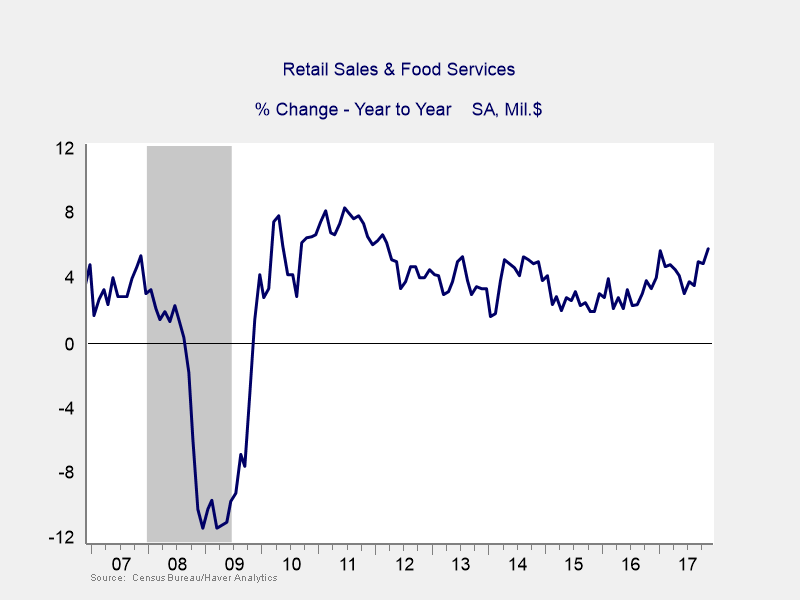
High consumer confidence translated into much better-than-expected spending heading into the holidays. Retail sales surprised to the upside, with headline and core sales both increasing 0.8 percent over October. On an annualized basis, retail spending growth sits at 5.8 percent, the highest level since 2012 (see Figure 1).
Figure 1. Retail Sales Annualized Change, 2007–2017
The Conference Board’s consumer comfort survey hit a 17-year high in November. Confidence declined a bit in December, though it remains very high.
Strong job growth supports confidence and spending. In November, 228,000 jobs were added. Underlying data was also strong, though wage growth was less than anticipated. But the tight labor market and healthy economic growth point to possible faster wage growth in 2018.
In December, homebuilder confidence increased to levels last seen in 1999. This confidence translated into more housing starts, leading to the second-highest annualized growth since 2008. Existing home sales were up 5.6 percent last month while new home sales skyrocketed 17.5 percent.
Businesses also confident—and spending
Business sentiment stayed strong last month, with industry surveys in healthy expansionary territory. Durable goods orders increased 1.3 percent in November. Core orders declined slightly, but that was offset by a positive revision to October’s strong growth. Industrial production and manufacturing output grew 0.2 percent in November.
Persistent political risk looms over markets
Here and abroad, the major sources of market risk are political. The Brexit process and continuing attempts to form a German government, issues surrounding North Korea, and the potential for a U.S. government shutdown could lead to market upheaval or adversely affect economic growth.
2018 starts with lots of momentum
High confidence, continued job and potential wage growth, increased spending, and improving economic fundamentals leave consumers and businesses in good shape entering the new year. Combine that with reduced regulation and the possible positive impact of tax reform, and we could see even faster growth in 2018.
Strong fundamentals should drive the economy and markets forward, but volatility is likely. The calm of 2017 is unlikely to last, so we must remember that markets can go down as well as up. A well-diversified portfolio that takes advantage of long-term growth opportunities remains the best path forward.
All information according to Bloomberg, unless stated otherwise.
Disclosure: Certain sections of this commentary contain forward-looking statements based on our reasonable expectations, estimates, projections, and assumptions. Forward-looking statements are not guarantees of future performance and involve certain risks and uncertainties, which are difficult to predict. Past performance is not indicative of future results. Diversification does not assure a profit or protect against loss in declining markets. All indices are unmanaged and investors cannot invest directly into an index. The Dow Jones Industrial Average is a price-weighted average of 30 actively traded blue-chip stocks. The S&P 500 Index is a broad-based measurement of changes in stock market conditions based on the average performance of 500 widely held common stocks. The Nasdaq Composite Index measures the performance of all issues listed in the Nasdaq Stock Market, except for rights, warrants, units, and convertible debentures. The MSCI EAFE Index is a float-adjusted market capitalization index designed to measure developed market equity performance, excluding the U.S. and Canada. The MSCI Emerging Markets Index is a market capitalization-weighted index composed of companies representative of the market structure of 26 emerging market countries in Europe, Latin America, and the Pacific Basin. It excludes closed markets and those shares in otherwise free markets that are not purchasable by foreigners. The Bloomberg Barclays Aggregate Bond Index is an unmanaged market value-weighted index representing securities that are SEC-registered, taxable, and dollar-denominated. It covers the U.S. investment-grade fixed-rate bond market, with index components for a combination of the Bloomberg Barclays government and corporate securities, mortgage-backed pass-through securities, and asset-backed securities. The Bloomberg Barclays U.S. Corporate High Yield Index covers the USD-denominated, non-investment-grade, fixed-rate, taxable corporate bond market. Securities are classified as high-yield if the middle rating of Moody’s, Fitch, and S&P is Ba1/BB+/BB+ or below.
###
Mark Gallagher is a financial advisor located at Gallagher Financial Services at 2586 East 7th Ave. Suite #304, North Saint Paul, MN 55109. He offers securities and advisory services as an Investment Adviser Representative of Commonwealth Financial Network®, Member FINRA/SIPC, a Registered Investment Adviser. He can be reached at 651-774-8759 or at mark@markgallagher.com.
Authored by Brad McMillan, senior vice president, chief investment officer, and Sam Millette, fixed income analyst, at Commonwealth Financial Network®.
© 2018 Commonwealth Financial Network®