Presented by Mark Gallagher
Stock markets have strong start to the year
All three major U.S. indices posted large gains in January, despite a dip at month-end. The Nasdaq Composite climbed 7.40 percent, the Dow Jones Industrial Average popped 5.88 percent, and the S&P 500 Index was up 5.73 percent.
Performance was supported by better-than-expected earnings results for the fourth quarter of 2017. According to FactSet, as of January 25, the blended earnings growth rate for the S&P 500 was 12 percent—up from estimates of 11-percent growth at the end of December.
U.S. markets were supported technically in January, with all three indices remaining above their respective trend lines.
International markets did equally as well. The MSCI EAFE Index increased 5.02 percent, and the MSCI Emerging Markets Index surged 8.34 percent. International stocks benefited from continued global expansion and a weaker dollar. Both indices also stayed above their 200-day moving averages.
Fixed income had a more challenging month, as increasing inflation expectations caused an upswing in rates. The yield on the 10-year U.S. Treasury rose from 2.46 percent to 2.72 percent during the month. This caused the Bloomberg Barclays U.S. Aggregate Bond Index to decline by 1.15 percent.
High-yield bonds had a better start. The Bloomberg Barclays U.S. Corporate High Yield Index managed a gain of 0.60 percent, and valuation levels remained near post-recession highs.
The economy keeps getting better
The first estimate of gross domestic product (GDP) growth for the fourth quarter of 2017 came in slightly below expectations at 2.6 percent. Nevertheless, strong spending and confidence levels indicate that growth could accelerate in 2018.
Corporate confidence continued to hold near multiyear highs. The Institute for Supply Management’s Manufacturing and Nonmanufacturing indices both retreated from December highs but remain in healthy expansionary territory.
Durable goods orders increased by 2.9 percent in December—the highest month-over-month growth level in six months.
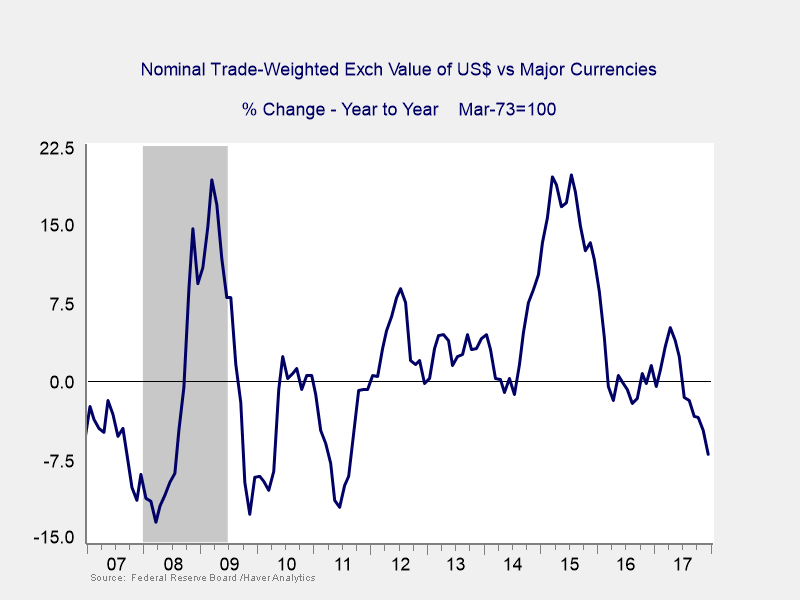
Industrial production and manufacturing output also grew. In fact, manufacturing had the strongest fourth quarter in seven years, likely due to the weaker dollar. As Figure 1 shows, the trade-weighted value of the dollar has declined nearly 7 percent year-over-year versus major currencies.
Figure 1. Trade-Weighted Exchange Value of the U.S. Dollar, Year-Over-Year Change
Consumers also confident—and spending
The Conference Board’s measure of consumer confidence increased by more than expected and sits at levels consistent with strong consumption growth.
On the spending side, both headline and core retail sales figures had another strong month. Personal spending data also was stronger than expected—growing 3.8 percent, annualized, in the fourth quarter.
Housing slowed in January, however. Homebuilder confidence pulled back from multidecade highs, while housing starts and permits both decreased due to rising construction costs and lack of labor. Existing and new home sales also declined from previous months. This slowdown may prove to be temporary, but as affordability declines, this remains a sector to watch.
On a more positive note, the U.S. added 200,000 jobs in January. December’s headline figure was also revised upward. Further, annual wage growth increased to 2.9 percent—a positive sign—and the unemployment rate stayed at 4.1 percent.
Political risks persist
Despite the healthy economic picture, political developments could rattle markets. The brief government shutdown in January was proof that politicians are willing to use this issue as leverage for their respective platforms. The next vote in February remains a concern, and there is a real possibility that this situation could get worse.
International risks have pulled back a bit. With the Olympics scheduled to begin in South Korea, and a delegation of North Korean athletes expected to compete, this may be a chance for further diplomatic efforts to resolve tensions in the region. In Europe, there seems to be real progress in the German governmental negotiations, and concerns about the pending Italian elections have lessened. Still, there is the potential for volatility if any negative developments occur.
Foundation in place for a strong year
Markets had a great start to the year, cushioned by a strong economy. The positive economic data and improving earnings situation should provide a strong tailwind to help weather potential short-term turbulence.
Risks exist, but many of the most pressing concerns have moderated. As always, a well-diversified portfolio that aligns with your time horizon can be the best way to achieve financial goals.
All information according to Bloomberg, unless stated otherwise.
Disclosure: Certain sections of this commentary contain forward-looking statements based on our reasonable expectations, estimates, projections, and assumptions. Forward-looking statements are not guarantees of future performance and involve certain risks and uncertainties, which are difficult to predict. Past performance is not indicative of future results. Diversification does not assure a profit or protect against loss in declining markets. All indices are unmanaged and investors cannot invest directly into an index. The Dow Jones Industrial Average is a price-weighted average of 30 actively traded blue-chip stocks. The S&P 500 Index is a broad-based measurement of changes in stock market conditions based on the average performance of 500 widely held common stocks. The Nasdaq Composite Index measures the performance of all issues listed in the Nasdaq Stock Market, except for rights, warrants, units, and convertible debentures. The MSCI EAFE Index is a float-adjusted market capitalization index designed to measure developed market equity performance, excluding the U.S. and Canada. The MSCI Emerging Markets Index is a market capitalization-weighted index composed of companies representative of the market structure of 26 emerging market countries in Europe, Latin America, and the Pacific Basin. It excludes closed markets and those shares in otherwise free markets that are not purchasable by foreigners. The Bloomberg Barclays Aggregate Bond Index is an unmanaged market value-weighted index representing securities that are SEC-registered, taxable, and dollar-denominated. It covers the U.S. investment-grade fixed-rate bond market, with index components for a combination of the Bloomberg Barclays government and corporate securities, mortgage-backed pass-through securities, and asset-backed securities. The Bloomberg Barclays U.S. Corporate High Yield Index covers the USD-denominated, non-investment-grade, fixed-rate, taxable corporate bond market. Securities are classified as high-yield if the middle rating of Moody’s, Fitch, and S&P is Ba1/BB+/BB+ or below.
Mark Gallagher is a financial advisor located at Gallagher Financial Services at 2586 East 7th Ave. Suite #304, North Saint Paul, MN 55109. He offers securities and advisory services as an Investment Adviser Representative of Commonwealth Financial Network®, Member FINRA/SIPC, a Registered Investment Adviser. He can be reached at 651-774-8759 or at mark@markgallagher.com.
Authored by Brad McMillan, senior vice president, chief investment officer, and Sam Millette, fixed income analyst, at Commonwealth Financial Network®.
© 2018 Commonwealth Financial Network®