Presented by Mark Gallagher
A bumpy ride for the markets
February was a rocky month for the stock market. After plunging roughly 10 percent mid-month, the three major U.S. indices were able to make up some ground. The Nasdaq Composite finished down 1.74 percent, while the Dow Jones Industrial Average and S&P 500 Index lost 3.96 percent and 3.69 percent, respectively. The first substantial market decline we’ve experienced in some time, it was driven largely by concerns over rising inflation and interest rates. Although worrying, this level of volatility is normal by historical standards.
Faster earnings growth continued to support the markets in February. In fact, fourth-quarter 2017 earnings came in well above expectations. According to FactSet, as of February 23, the estimated earnings growth rate for the S&P 500 was 14.8 percent.
Technical factors were also supportive of equity markets. All three U.S. indices were above their respective 200-day moving averages at month-end, despite the earlier drop.
International equities also had it rough. The MSCI EAFE Index of developed markets declined 4.51 percent, while the MSCI Emerging Markets Index was down 4.60 percent. Rising global interest rates fueled much of the volatility, even as economic fundamentals remained supportive. Technicals also were supportive, as both indices ended the month above their respective trend lines.
There was no escape for fixed income either, as rising interest rates dragged down bond prices. The Bloomberg Barclays U.S. Aggregate Bond Index experienced a 0.95-percent decline. Typically less affected by interest rate changes, high-yield bonds lost 0.85 percent.
Economic growth continues, but at a slower pace
U.S. gross domestic product growth for the fourth quarter of 2017 was revised down to 2.5 percent, primarily due to a larger-than-expected increase in imports. Still, there were plenty of bright spots.
The economy added 200,000 jobs in January, average hourly wage growth hit the highest level since 2009, and unemployment remained unchanged at 4.1 percent.
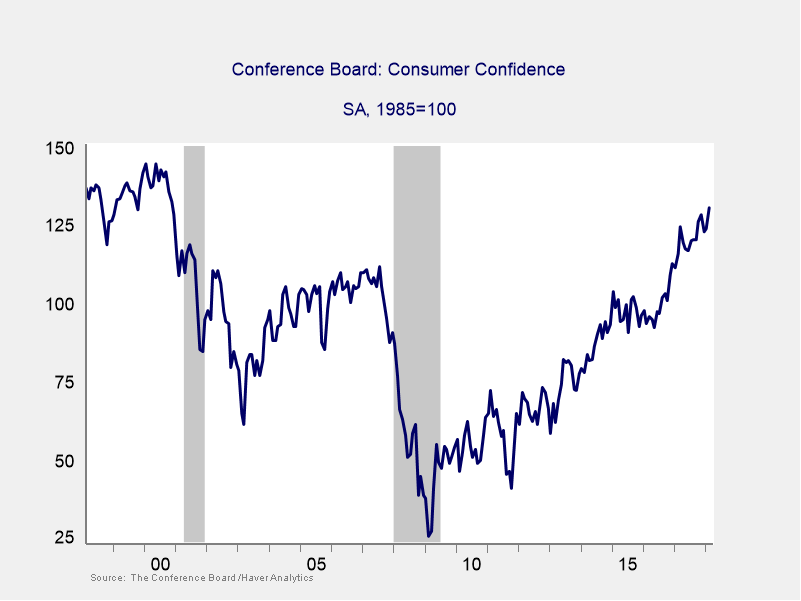
Meanwhile, both major consumer sentiment surveys increased by more than expected in January, despite rising gas prices and stock market turbulence. The Conference Board’s Consumer Confidence Index is now at levels last seen in 2000 (see Figure 1).
Figure 1. Conference Board Consumer Confidence Index, 1998–2018
Businesses were confident as well. The Institute for Supply Management’s Manufacturing and Nonmanufacturing surveys moved to 13-year highs in February, indicating continued business investment and expansion. The hard data was somewhat weaker than expected, though. Core durable goods orders, which exclude volatile aircraft purchases, fell 0.3 percent.
Given this strong environment, markets expect the Federal Reserve to hike interest rates by 25 basis points at the March meeting.
Housing a drag
Despite improvements elsewhere, housing growth slowed. Homebuilder confidence remained near multiyear highs, but home sales fell for the second month in a row. A combination of rising mortgage rates and low supply levels likely contributed to the decline. Increases in housing starts and permits—by 9.7 percent and 7.4 percent, respectively—in January should help supply going forward.
Political risks recede—for the moment
Politics, a major source of risk for the markets, have started to recede. In the U.S., following the brief government shutdown on February 8, Congress cut a deal both to lift the debt ceiling until September 2019 and to increase spending.
In Asia, with all eyes on the U.S. and North Korean delegations at the Winter Olympics, a willingness for diplomatic talks was a de-escalation of the fiery rhetoric between the countries.
In Germany, Angela Merkel’s attempts to form a coalition government and end a political state of limbo were finally successful after months of negotiations.
Of course, political risk can reemerge at any time. Notably, on March 1, an announcement that the U.S. planned to impose tariffs on steel and aluminum imports sparked worries about a trade war, sending markets into decline.
Real slowdown or blip?
February was a more difficult month than we have seen in some time. That said, growth remains in healthy territory. Plus, strong corporate sales and profits should continue to support the financial markets. What this month’s volatility gave us was a wake-up call, reminding investors that markets can go down as well as up.
This is just a return to normal, however, which is a good thing. The U.S. economy and financial markets are well positioned for long-term growth. A well-diversified portfolio designed around your financial objectives and time horizon remains the best way to pursue your goals.
All information according to Bloomberg, unless stated otherwise.
Disclosure: Certain sections of this commentary contain forward-looking statements based on our reasonable expectations, estimates, projections, and assumptions. Forward-looking statements are not guarantees of future performance and involve certain risks and uncertainties, which are difficult to predict. Past performance is not indicative of future results. Diversification does not assure a profit or protect against loss in declining markets. All indices are unmanaged and investors cannot invest directly into an index. The Dow Jones Industrial Average is a price-weighted average of 30 actively traded blue-chip stocks. The S&P 500 Index is a broad-based measurement of changes in stock market conditions based on the average performance of 500 widely held common stocks. The Nasdaq Composite Index measures the performance of all issues listed in the Nasdaq Stock Market, except for rights, warrants, units, and convertible debentures. The MSCI EAFE Index is a float-adjusted market capitalization index designed to measure developed market equity performance, excluding the U.S. and Canada. The MSCI Emerging Markets Index is a market capitalization-weighted index composed of companies representative of the market structure of 26 emerging market countries in Europe, Latin America, and the Pacific Basin. It excludes closed markets and those shares in otherwise free markets that are not purchasable by foreigners. The Bloomberg Barclays Aggregate Bond Index is an unmanaged market value-weighted index representing securities that are SEC-registered, taxable, and dollar-denominated. It covers the U.S. investment-grade fixed-rate bond market, with index components for a combination of the Bloomberg Barclays government and corporate securities, mortgage-backed pass-through securities, and asset-backed securities. The Bloomberg Barclays U.S. Corporate High Yield Index covers the USD-denominated, non-investment-grade, fixed-rate, taxable corporate bond market. Securities are classified as high-yield if the middle rating of Moody’s, Fitch, and S&P is Ba1/BB+/BB+ or below.
Mark Gallagher is a financial advisor located at Gallagher Financial Services at 2586 East 7th Ave. Suite #304, North Saint Paul, MN 55109. He offers securities and advisory services as an Investment Adviser Representative of Commonwealth Financial Network®, Member FINRA/SIPC, a Registered Investment Adviser. He can be reached at 651-774-8759 or at mark@markgallagher.com.
Authored by Brad McMillan, CFA®, CAIA, MAI, managing principal, chief investment officer, and Sam Millette, fixed income analyst, at Commonwealth Financial Network®.
© 2018 Commonwealth Financial Network®