Presented by Mark Gallagher
Positive month for markets caps off turbulent quarter
U.S. markets had a positive September, which helped offset volatility earlier in the quarter. The S&P 500 returned 1.87 percent in September and 1.70 percent for the quarter. The Dow Jones Industrial Average performed better, with a 2.05 percent monthly gain and quarterly growth of 1.83 percent. The Nasdaq Composite lagged, with a 0.54 percent monthly gain, taking the index to a 0.18 percent gain for the quarter.
These positive results for the month came despite worsening fundamentals. According to Bloomberg Intelligence (as of September 30, 2019), the S&P 500 is expected to show a year-over-year earnings decline of 3.2 percent for the third quarter. This result is down from the 3 percent decline forecast at the end of August. Although the estimates are negative, earnings season will kick off in earnest midmonth. As such, we’ll have a better picture of the actual results next month. Looking forward, analysts expect 3.3 percent growth in the fourth quarter. This growth could likely help support further market gains. From a technical perspective, all three major U.S. indices were supported, spending the entire month above their respective 200-day trend lines.
International stocks had a strong September. But the month’s positive results did not offset volatility seen earlier in the quarter. The MSCI EAFE Index gained a solid 2.87 percent in September but still had a quarterly loss of 1.07 percent. Emerging markets also gained during the month, at 1.94 percent, but showed a drop of 4.11 percent for the quarter. In both developed and emerging markets, rising political concerns and slowing growth figures weighed on investors.
Technicals were mixed for international stocks. The MSCI EAFE Index for developed international markets fell below its trend line at the start of the month. Still, it recovered and spent the rest of the month above trend. Emerging markets were another story. Here, the index spent the majority of the month below the trend line. September marks the second straight month in which technicals for emerging markets have been a headwind.
Finally, fixed income markets had a tough month. Whipsawing interest rates created volatility, despite the Federal Reserve’s move to cut the federal funds rate by 25 basis points at its September meeting. The 10-year Treasury yield started the month at 1.47 percent. It then rose to a midmonth high of 1.90 percent and finished the period at 1.67 percent. This result is down from the 2.03 percent yield seen at the beginning of the quarter.
The Bloomberg Barclays U.S. Aggregate Bond Index declined by 0.53 percent during the month, on higher rates during that time period. But it rose by 2.27 percent during the quarter, as rates went down. High-yield bonds, which are less affected by interest rate changes, had a better month with a gain of 0.36 percent. This move led the high-yield index to a 1.33 percent gain for the quarter.
Headlines hit markets, but not much
In September, there were many headline-grabbing events. For example, the drone attack on Saudi Arabian oil facilities took out an estimated half of Saudi production capacity. It was a major news story that touched on many sensitive geopolitical concerns. Still, there was no sustained impact on U.S. equity markets. Oil prices did spike as high as 20 percent immediately following the attack. But they ended September well below midmonth highs, as the U.S. and Saudi governments committed to tapping reserves and prioritizing repairs at the damaged facilities. Further, oil prices remain well below levels seen a year ago, and markets seemed to shrug off this event.
The continuing U.S.-China trade war and the slow and steady march toward Brexit also made news in September. The escalated trade war hurt markets in August, but neither story had much influence on markets in September. On the trade war front, new negotiations between the U.S. and China are scheduled for October. This announcement helped drive up equity markets at the beginning of the month. Unfortunately, this bump didn’t last long, as the S&P 500 ended the month below post-announcement highs.
Threats of a no-deal Brexit from British Prime Minister Boris Johnson drove international market volatility in August. But in September? The impact of Brexit on international markets was minimal. Here, developments have moved swiftly over the past month. The British Parliament and Johnson are trying to negotiate a trade deal with the European Union before the October 31 deadline. This situation may be a source of future volatility, especially for internationally developed markets.
Economic fundamentals withstand the risks
The political risks continued to draw attention in September. Nonetheless, many economic releases came in better than expected, with consumer spending continuing to play a key role. August’s retail sales figures beat expectations. Here, we saw 0.4 percent growth against expectations for a 0.2 percent increase. This result marks the sixth straight month of retail sales growth. Consumers have been driving the economic expansion for the past two quarters.
Much of this spending growth appears to be sustainable, which is encouraging. Personal income grew by 0.4 percent in August, which marks the eighth straight month of income growth. There is also some evidence that the tight jobs market is leading to faster wage growth. Indeed, August’s employment report showed wages up 0.4 percent on a monthly basis. Wage growth over the trailing three months is currently at its highest annualized rate in 11 years. This growth bodes well for future consumer spending.
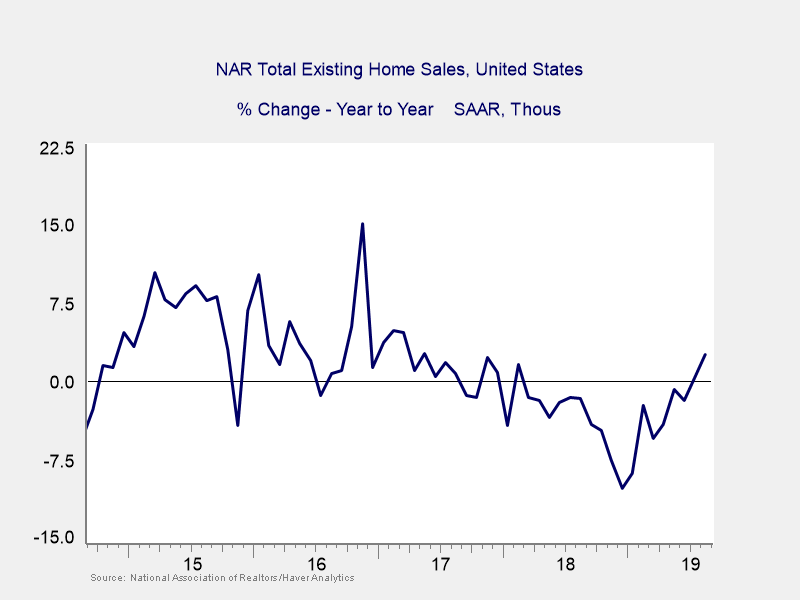
Another key area of strength was the housing sector. It showed solid growth for the second straight month. In September, homebuilder confidence increased to an 11-month high. Here, strong homebuyer demand and low mortgage rates boosted sales. In fact, both new and existing home sales grew by more than expected in August. Existing home sales were especially impressive, with August marking the second straight month of year-over-year growth. As illustrated in Figure 1, existing home sales have struggled to show any year-over-year growth over the past two years. So, these back-to-back solid months are very encouraging.
Figure 1. Existing Home Sales, September 2014–August 2019
Now, let’s move from the consumer to the business side of the economy. Nonmanufacturer confidence saw a solid rebound in August. The service sector accounts for the lion’s share of economic output. So, this result helped calm fears of a slowdown in the service sector and was a very good development. There was even a positive surprise for the manufacturing sector. Manufacturing output rose by a strong 0.5 percent in August, despite a drop in manufacturer confidence during that time.
Beware the risks ahead
Despite the positive fundamentals, risks remain that could have a dramatic effect on markets. Domestically, the beginning of impeachment proceedings at month-end will likely lead to a contentious election cycle. Of course, the direct economic impact from impeachment proceedings is difficult to forecast. But the uncertainty of this situation will likely weigh on consumer and business confidence and spending. Slowing job growth and declining consumer confidence figures are also areas to watch. Both could lead to lowered spending and economic growth.
Abroad, the ongoing U.S.-China trade war and Brexit have the potential to affect markets. As we saw in September, there is no telling what will happen with these politically sensitive issues. Plus, there is no guarantee that markets will react to new developments as expected.
Risks can hit markets at any time. When looking at the sheer number of them, it seems likely that one or more of the recent stories will disrupt markets in the near future. October is known to be a difficult month for markets, which has elevated the concerns.
Even if we do see a pullback, there is still a lot to like about the U.S. economy. These economic strengths should help cushion any market downturn. Consumer spending growth has been healthy this year, and there are few signs of a slowdown in the immediate future. The rebound in service sector confidence and manufacturing output also indicates that the fundamentals may be more resilient than they seem. Again, this strength could help protect against any short-term disruptions.
Ultimately, volatility is possible and may even be likely over the next few months. But the healthy U.S. economic background should help calm fears of a sustained downturn if and when we face market turbulence. As always, a well-diversified portfolio combined with a long-term view toward investing remains the best way forward in an uncertain world.
All information according to Bloomberg, unless stated otherwise.
Disclosure: Certain sections of this commentary contain forward-looking statements based on our reasonable expectations, estimates, projections, and assumptions. Forward-looking statements are not guarantees of future performance and involve certain risks and uncertainties, which are difficult to predict. Past performance is not indicative of future results. Diversification does not assure a profit or protect against loss in declining markets. All indices are unmanaged and investors cannot invest directly into an index. The Dow Jones Industrial Average is a price-weighted average of 30 actively traded blue-chip stocks. The S&P 500 Index is a broad-based measurement of changes in stock market conditions based on the average performance of 500 widely held common stocks. The Nasdaq Composite Index measures the performance of all issues listed in the Nasdaq Stock Market, except for rights, warrants, units, and convertible debentures. The MSCI EAFE Index is a float-adjusted market capitalization index designed to measure developed market equity performance, excluding the U.S. and Canada. The MSCI Emerging Markets Index is a market capitalization-weighted index composed of companies representative of the market structure of 26 emerging market countries in Europe, Latin America, and the Pacific Basin. It excludes closed markets and those shares in otherwise free markets that are not purchasable by foreigners. The Bloomberg Barclays Aggregate Bond Index is an unmanaged market value-weighted index representing securities that are SEC-registered, taxable, and dollar-denominated. It covers the U.S. investment-grade fixed-rate bond market, with index components for a combination of the Bloomberg Barclays government and corporate securities, mortgage-backed pass-through securities, and asset-backed securities. The Bloomberg Barclays U.S. Corporate High Yield Index covers the USD-denominated, non-investment-grade, fixed-rate, taxable corporate bond market. Securities are classified as high-yield if the middle rating of Moody’s, Fitch, and S&P is Ba1/BB+/BB+ or below.
Mark Gallagher is a financial advisor located at Gallagher Financial Services at 2586 East 7th Ave. Suite #304, North Saint Paul, MN 55109. He offers securities and advisory services as an Investment Adviser Representative of Commonwealth Financial Network®, Member FINRA/SIPC, a Registered Investment Adviser. He can be reached at 651-774-8759 or at mark@markgallagher.com.
Authored by Brad McMillan, CFA®, CAIA, MAI, managing principal, chief investment officer, and Sam Millette, senior investment research analyst, at Commonwealth Financial Network®.
© 2019 Commonwealth Financial Network ®