Presented by Mark Gallagher
Volatile June caps off eventful quarter
June was a volatile month, with earlier gains offset by later losses. Still, both the S&P 500 Index and the Nasdaq Composite ended the month in positive territory. The S&P 500 rose 0.62 percent during the month, while the Nasdaq led the way with a gain of 0.98 percent. The Dow Jones Industrial Average was the lone exception, as it declined 0.49 percent.
All three U.S. indices were positive for the quarter. The S&P 500 was up 3.43 percent for the period, and the Dow gained 1.26 percent. But the Nasdaq did best, rising 6.61 percent.
Despite the volatility at month-end, the fundamentals for U.S. markets remained positive. According to FactSet, the estimated earnings growth rate for the S&P 500 in the second quarter stands at 20 percent (as of June 29). This would represent the second-highest quarterly earnings growth since 2011. We know that fundamentals drive long-term performance. If companies meet expectations, then this strong second-quarter growth should encourage further performance.
While fundamentals were supportive for the month, technicals were mixed. The S&P 500 and the Nasdaq remained above their long-term trend lines. The Dow, on the other hand, dropped below its trend line for the first time since June 2016. This is worth watching, but a drop like this is not that unusual. In fact, the S&P 500 closed below its 200-day moving average in April before quickly recovering.
Now let’s turn to foreign stocks, which did worse in June than the U.S. markets. The MSCI EAFE Index, which represents developed markets, declined by 1.22 percent during the month. This drop took it from roughly even to a decline of 1.07 percent for the quarter. Emerging markets did even worse. The MSCI Emerging Markets Index declined by 4.09 percent for the month and by 7.73 percent for the quarter, on a rising dollar and growing policy concerns.
Technical factors for international equities also weakened during June. The MSCI EAFE Index spent the second half of the month below its 200-day moving average. This drop came after the European Central Bank announced that it plans to end its stimulus programs and to hike rates within the next year. Emerging markets did even worse from a technical perspective; they spent almost the entire month beneath the trend line.
Fixed income also had a challenging month and quarter, as rising rates negatively affected prices. As expected, the Federal Reserve (Fed) voted to hike the federal funds rate by 25 basis points at its June meeting. Further, the statement released by the Fed was more optimistic about the economy than expected, suggesting that more rate hikes are likely.
The Bloomberg Barclays U.S. Aggregate Bond Index declined by 0.12 percent during the month and by 0.16 percent for the quarter. The 10-year U.S. Treasury yield started the quarter at 2.73 percent. It reached a high of 3.11 percent before ending the quarter at 2.85 percent.
High-yield bonds, which are typically less tied to moves in Treasury rates, had a better month and quarter than did investment-grade fixed income. The Bloomberg Barclays U.S. Corporate High Yield Index gained 0.40 percent during the month and 1.03 percent during the quarter. Spreads remained in the 3-percent to 4-percent range during the quarter, as investors continued to find high-yield bonds attractive.
Employment and spending show strong growth
Most of June’s major data releases painted a picture of stronger growth in the second quarter. Consumers and businesses saw high levels of confidence and spending growth throughout the month. Although consumer confidence did decline slightly in June, both major measures of confidence remain near multidecade highs. Historically, the health of the jobs market has been one of the main factors that influences confidence. So, it is no surprise that confidence remains high after May’s strong employment report.
The economy added 223,000 new jobs in May, beating expectations. The unemployment rate fell to an 18-year low of 3.8 percent, and the underemployment rate declined. Wage growth came in better than expected. It increased to 2.7 percent on an annual basis, close to the highest level since the crisis. Strong employment growth has been a major driver of the ongoing economic expansion, but wage growth has lagged. As such, this uptick in annual wages is very encouraging.
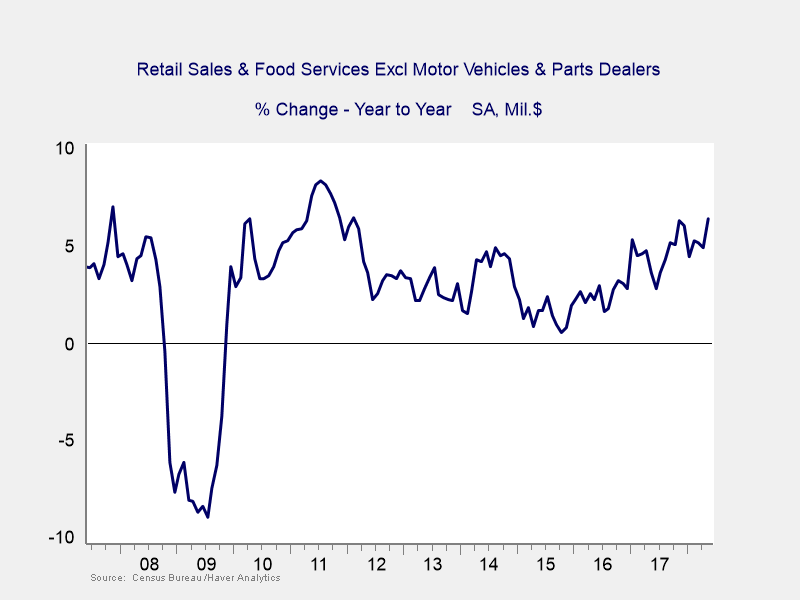
Wage growth is important, but just as important is consumer willingness to spend. Here again, the news was positive. The combination of income growth and high confidence led to faster spending growth. Overall spending grew by 0.6 percent, well above expectations of 0.4 percent. The retail sales data was even better, with 0.8-percent headline growth in May. The core figure, which strips out volatile vehicle purchases, rose by 0.5 percent on a month-over-month basis. This rise brought year-over-year core retail sales growth to its highest level since early 2012, as you can see in Figure 1.
Figure 1. Core Retail Sales, 2007–2018
While consumer spending growth was positive across the board, business spending was mixed. May data was weak, with durable goods orders dropping by 0.7 percent. This drop was due in large part to a dramatic 7-percent decline in the volatile transportation sector. The core figure, which excludes transportation, fell by a more modest 0.3 percent in May. Despite the weak month, a positive revision from 0.9-percent to 1.9-percent growth in April left the quarterly figure looking healthy. The overall trend for business investment remains positive.
Housing a drag on growth
Although the economy is generally healthy, there are signs of slowing growth. After a multiyear period of solid growth—driven by low mortgage rates and relatively affordable prices—housing appears to have slowed.
On the supply side, home builder confidence dropped in June. Here, rising lumber costs and a lack of labor hurt the profitability of new home construction. Building permits, which are the first step for new home construction, echoed the decline in home builder confidence. They fell by 4.6 percent during the month. On the demand side, home buyers appear to be taking rising home costs in stride, as new home sales rose by more than expected in May. Existing home sales dropped slightly, suggesting that declining affordability may be starting to make a difference. Housing growth has historically had a multiplier effect on overall economic growth as new home buyers spend more on furnishings and repairs. So, any slowdown in housing is something that should be monitored closely.
Political risks continue to affect markets
While the economy is growing at a healthy pace, politics and policy present the biggest risks to the financial markets. Again, the news here is a bit of a mixed bag. On a positive note, last month’s major concerns surrounding a euroskeptic government in Italy and the summit between President Trump and North Korea’s Kim Jong-un have largely subsided. But these very real improvements have been overshadowed by growing concerns about trade conflict. These worries have been fueled by the U.S. imposition of tariffs, along with the subsequent retaliatory actions from most major global economies.
It is still too early to know exactly how the trade conflict will play out. The probability remains that a negotiated deal will be reached before matters become much more serious. Nonetheless, effects are already showing up in the economy. If the situation does worsen, it will almost certainly lead to lower levels of growth both domestically and abroad.
Economic growth expected to continue
While rising political risks are a valid concern, the U.S. economy continues to grow at a solid pace. The positive tailwinds from tax reform and the strong jobs market are driving consumer and business spending, which in turn should lead to faster economic growth for the rest of the year.
There are certainly risks to this outlook—namely a slowdown in housing and rising political risks. On the whole, however, things appear to be pretty good right now. Of course, risks can always materialize and affect markets. As such, a well-diversified portfolio that matches goals and time horizons is still the best way to prepare for the future and weather the potential storm.
All information according to Bloomberg, unless stated otherwise.
Disclosure: Certain sections of this commentary contain forward-looking statements based on our reasonable expectations, estimates, projections, and assumptions. Forward-looking statements are not guarantees of future performance and involve certain risks and uncertainties, which are difficult to predict. Past performance is not indicative of future results. Diversification does not assure a profit or protect against loss in declining markets. All indices are unmanaged and investors cannot invest directly into an index. The Dow Jones Industrial Average is a price-weighted average of 30 actively traded blue-chip stocks. The S&P 500 Index is a broad-based measurement of changes in stock market conditions based on the average performance of 500 widely held common stocks. The Nasdaq Composite Index measures the performance of all issues listed in the Nasdaq Stock Market, except for rights, warrants, units, and convertible debentures. The MSCI EAFE Index is a float-adjusted market capitalization index designed to measure developed market equity performance, excluding the U.S. and Canada. The MSCI Emerging Markets Index is a market capitalization-weighted index composed of companies representative of the market structure of 26 emerging market countries in Europe, Latin America, and the Pacific Basin. It excludes closed markets and those shares in otherwise free markets that are not purchasable by foreigners. The Bloomberg Barclays Aggregate Bond Index is an unmanaged market value-weighted index representing securities that are SEC-registered, taxable, and dollar-denominated. It covers the U.S. investment-grade fixed-rate bond market, with index components for a combination of the Bloomberg Barclays government and corporate securities, mortgage-backed pass-through securities, and asset-backed securities. The Bloomberg Barclays U.S. Corporate High Yield Index covers the USD-denominated, non-investment-grade, fixed-rate, taxable corporate bond market. Securities are classified as high-yield if the middle rating of Moody’s, Fitch, and S&P is Ba1/BB+/BB+ or below.
Mark Gallagher is a financial advisor located at Gallagher Financial Services at 2586 East 7th Ave. Suite #304, North Saint Paul, MN 55109. He offers securities and advisory services as an Investment Adviser Representative of Commonwealth Financial Network®, Member FINRA/SIPC, a Registered Investment Adviser. He can be reached at 651-774-8759 or at mark@markgallagher.com.
Authored by Brad McMillan, CFA®, CAIA, MAI, managing principal, chief investment officer, and Sam Millette, fixed income analyst, at Commonwealth Financial Network®.
© 2018 Commonwealth Financial Network®