Presented by Mark Gallagher
Strong December caps off terrific year for markets
What a difference a year can make. At the end of 2018, markets were selling off due to political concerns, and the year finished on a sour note. But 2019 had a significantly better ending for investors. Markets experienced solid gains in December, capping off an impressive quarter and year. All three major U.S. indices were up for the month; the S&P 500 returned 3.02 percent, the Dow Jones Industrial Average (DJIA) gained 1.87 percent, and the Nasdaq Composite rose 3.63 percent. This positive performance led to a quarterly gain of 9.07 percent for the S&P 500, 6.67 percent for the DJIA, and 12.47 percent for the Nasdaq. The annual figures are even more impressive, with the S&P returning 31.49 percent, while the DJIA and Nasdaq grew by 25.34 percent and 36.69 percent, respectively.
This strong performance came despite weak fundamentals. Per Bloomberg Intelligence, earnings for the S&P 500 fell by 1.2 percent during the third quarter, which marks the second straight quarter with declining earnings. Although this result was disappointing, it was better than anticipated, as analysts originally forecasted a decline of 3.6 percent. Looking forward, analysts expect earnings to decline in the fourth quarter before returning to growth in the first quarter of 2020. Over the long term, fundamentals drive performance, so a return to earnings growth would be a boon for equity markets. From a technical perspective, markets were well supported, with all three indices spending the entire month and quarter above their respective 200-day moving averages.
International markets also had a strong month, quarter, and year, despite suffering from more volatility than their domestic counterparts. The MSCI EAFE Index gained 3.25 percent in December, which contributed to a quarterly gain of 8.17 percent and an annual return of 22.01 percent. The MSCI Emerging Markets Index had a very strong end to the year, gaining 7.53 percent for the month, 11.93 percent for the quarter, and 18.90 percent for the year. From a technical perspective, both the developed and emerging market indices spent time below their trendlines in October, but they recovered and spent November and December comfortably above their 200-day trend lines.
Fixed income had a more challenging month, as rising rates put a damper on returns. The 10-year Treasury yield ended November at 1.78 percent and fell as low as 1.72 percent during the month before finishing December at 1.92 percent. The volatile rate environment caused the Bloomberg Barclays U.S. Aggregate Bond Index to fall by 0.07 percent in December. The index returned 0.18 percent for the quarter and a more impressive 8.72 percent for the year, as long-term rates fell significantly in 2019.
High-yield bonds, which are typically less affected by changes in interest rates, had positive results over the past month, quarter, and year. The Bloomberg Barclays U.S. Corporate High Yield Index returned 2 percent in December, leading to a quarterly gain of 2.61 percent and an annual return of 14.32 percent. High-yield spreads tightened during the course of the year, falling from 5.35 percent at the start of January to 3.60 percent at the end of December.
Economic growth continues
December’s economic updates continued to paint a picture of steady growth for the economy. Third-quarter gross domestic product (GDP) showed the economy growing at an annualized rate of 2.1 percent, which was much better than initial economist estimates of 1.6 percent. This result was also an improvement on the second quarter, when GDP grew at a 2 percent annualized rate. Although third-quarter growth came in below the 3.1 percent growth rate we saw in the first quarter of 2019, this better-than-expected result helped calm concerns of a more serious slowdown for the economy.
The major driver of economic growth in the third quarter was consumer spending, with personal consumption growing at an annualized rate of 3.2 percent during the quarter. Although this is down from the 4.1 percent growth rate in the second quarter, it’s better than initial estimates of 2.9 percent annualized growth.
In addition, data released in December showed that consumer spending continued to grow in the fourth quarter. For example, November’s personal income and spending reports highlighted the strength in spending growth we saw in 2019. The 0.4 percent increase in November’s personal spending marked the ninth straight month of growth, including solid 0.3 percent growth in October. Consumer spending growth was well supported by personal income growth throughout the year as well, indicating that spending increases in 2019 are sustainable as we head into 2020. Spending growth was driven by high consumer confidence, which, in turn, was buoyed by a better-than-expected November jobs report and equity markets setting all-time highs throughout the month.
Looking forward, the three rate cuts from the Federal Reserve (Fed) in 2019 should help spur additional spending growth in the new year. Lowered interest rates allow consumers to spend more, especially on big-ticket items like cars and houses. We’ve already seen the positive effect lowered rates can have on the housing market, which experienced a rebound following a slowdown in 2018 and early 2019.
Rebound in housing marches on
The housing sector of the economy has been one of the bright spots in the current economic expansion over the past two quarters. High consumer confidence and lowered mortgage rates have drawn additional home buyers into the market, driving up sales of both existing and new homes. New home sales have been especially impressive; they hit their highest monthly level since 2007 in November, putting them up more than 18 percent on a year-over-year basis.
Home builders have benefited from the increased demand for housing, with home builder confidence rising to a 20-year high to end the year. As you can see in Figure 1, this is a very impressive rebound following a decline to a three-year low at the end of 2018. Home builders have backed up this increased confidence by building more, with November’s housing starts representing the second-highest monthly level since 2007.
Figure 1. NAHB Housing Market Index, 1999–Present
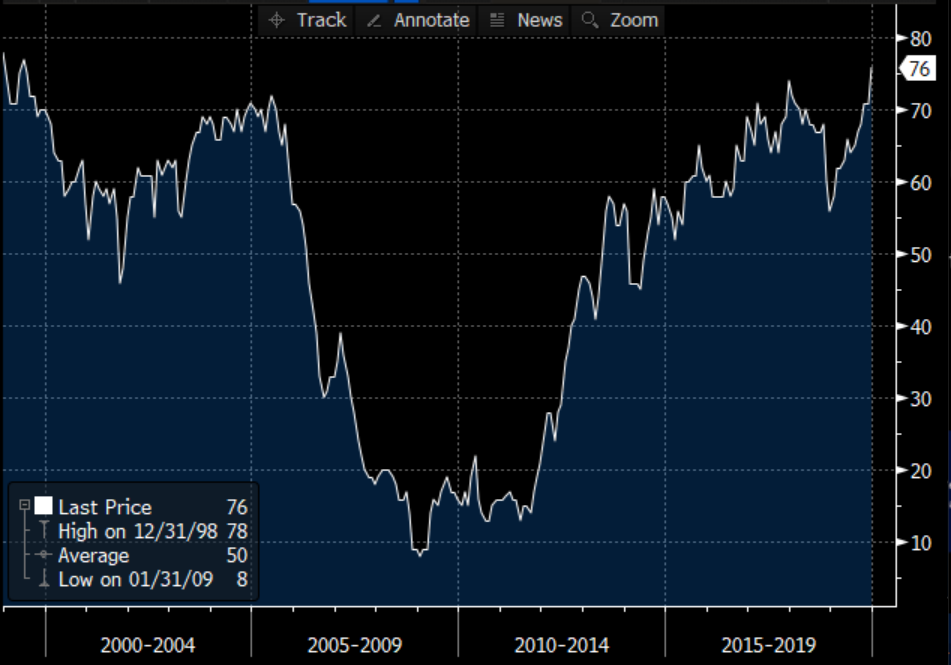
Source: National Association of Home Builders
As we saw during the most recent recession, the housing sector can have an outsize effect on the overall economy. So, this turnaround in the second half of 2019 is very encouraging as we head into the new year.
Risks continue to shift
Despite the strength in consumer spending we saw in 2019, very real risks to economic expansion remain. Business confidence continued to disappoint, with both the Institute for Supply Management Manufacturing and Nonmanufacturing indices unexpectedly declining in November. Manufacturing confidence has been especially disappointing, with the index remaining in contractionary territory for the past four months. Business investment has also been weaker than expected, as evidenced by November’s durable goods orders, which fell by 2 percent against expectations for a 1.5 percent increase. Although business confidence and spending were disappointing throughout 2019, there is the potential for a rebound in 2020, given continued progress with the trade talks between the U.S. and China.
Speaking of trade, the announcement of a preliminary “phase one” trade deal between the U.S. and China midmonth was a clear de-escalation in the ongoing trade war, even if the direct economic impact from the agreement may be minimal. At the very least, this agreement shows a willingness from both sides to continue to negotiate and makes additional tariffs seem unlikely for the time being. Although trade war-related risks may have decreased during the month, as we saw throughout 2019, these trade negotiations are a politically charged process that have the potential to affect markets at any time. The ongoing protests in Hong Kong and their increasing relevance in trade talks are an example of the unpredictable nature of this complex situation.
Another major political development in December was the general election in the U.K. Prime Minister Boris Johnson’s Conservative party consolidated power in advance of the January 31 deadline for the U.K.’s formal exit from the European Union. The ongoing negotiations on the terms of this exit will likely continue to serve as a potential source of volatility for international markets as we approach the latest deadline.
Finally, while they have not yet had a direct effect on markets, the ongoing impeachment proceedings in the U.S. still have the potential to create volatility. Previous impeachment proceedings have created short-term market disruptions, so this is certainly something to watch for—especially if a trial in the Senate becomes a drawn-out affair that creates uncertainty for market participants. For the time being, impeachment is not a major driver of volatility for markets, but it may become one in the future and should be monitored.
Better year than expected
All things considered, 2019 was a better year for markets and the economy than expected amid all the doom and gloom at the end of 2018. Strong consumer spending helped power further market gains here at home, even though lowered business investment and confidence remain areas of concern. Compared with where we were last year—with predictions of a recession and markets showing red for the year—2019 turned out much better than expected and puts us in a good position for growth in 2020.
Although we may have experienced a bit of a slowdown earlier in the year, slow growth is still growth and should be welcomed. Looking forward, continued support from the Fed, along with the anticipated return to earnings growth in 2020, should allow for continued market gains. With that being said, real risks to this outlook remain, especially politically. An unexpected result from the ongoing U.S.-China trade talks or further delays to the Brexit process could certainly lead to market volatility.
Despite the potential for future short-term market disruptions, the healthy economic fundamentals should support markets in the new year. Volatility has the potential to cause short-term pain for investors, but a well-diversified portfolio that matches investor goals and time horizons remains the best path forward.
All information according to Bloomberg, unless stated otherwise.
Disclosure: Certain sections of this commentary contain forward-looking statements based on our reasonable expectations, estimates, projections, and assumptions. Forward-looking statements are not guarantees of future performance and involve certain risks and uncertainties, which are difficult to predict. Past performance is not indicative of future results. Diversification does not assure a profit or protect against loss in declining markets. All indices are unmanaged and investors cannot invest directly into an index. The Dow Jones Industrial Average is a price-weighted average of 30 actively traded blue-chip stocks. The S&P 500 Index is a broad-based measurement of changes in stock market conditions based on the average performance of 500 widely held common stocks. The Nasdaq Composite Index measures the performance of all issues listed in the Nasdaq Stock Market, except for rights, warrants, units, and convertible debentures. The MSCI EAFE Index is a float-adjusted market capitalization index designed to measure developed market equity performance, excluding the U.S. and Canada. The MSCI Emerging Markets Index is a market capitalization-weighted index composed of companies representative of the market structure of 26 emerging market countries in Europe, Latin America, and the Pacific Basin. It excludes closed markets and those shares in otherwise free markets that are not purchasable by foreigners. The Bloomberg Barclays Aggregate Bond Index is an unmanaged market value-weighted index representing securities that are SEC-registered, taxable, and dollar-denominated. It covers the U.S. investment-grade fixed-rate bond market, with index components for a combination of the Bloomberg Barclays government and corporate securities, mortgage-backed pass-through securities, and asset-backed securities. The Bloomberg Barclays U.S. Corporate High Yield Index covers the USD-denominated, non-investment-grade, fixed-rate, taxable corporate bond market. Securities are classified as high-yield if the middle rating of Moody’s, Fitch, and S&P is Ba1/BB+/BB+ or below.
Mark Gallagher is a financial advisor located at Gallagher Financial Services at 2586 East 7th Ave. Suite #304, North Saint Paul, MN 55109. He offers securities and advisory services as an Investment Adviser Representative of Commonwealth Financial Network®, Member FINRA/SIPC, a Registered Investment Adviser. He can be reached at 651-774-8759 or at mark@markgallagher.com.
Authored by Brad McMillan, CFA®, CAIA, MAI, managing principal, chief investment officer, and Sam Millette, senior investment research analyst, at Commonwealth Financial Network®.
© 2020 Commonwealth Financial Network ®