Presented by Mark Gallagher
Markets Rally in November
November saw continued market gains, as all three major U.S. indices rose for the second consecutive month. The S&P 500 returned 5.59 percent during the month, while the Dow Jones Industrial Average (DJIA) notched a 6.04 percent return. The Nasdaq Composite also had a solid month, with the technology-heavy index increasing 4.51 percent. Equity markets were supported by rising optimism from investors that the Federal Reserve (Fed) is set to start slowing the pace of rate hikes in the near future.
These positive results were also supported by solid fundamentals. Per Bloomberg Intelligence, as of November 23, 2022, with 96 percent of companies having reported actual earnings, the blended earnings growth rate for the S&P 500 in the third quarter was 4.49 percent. This is up from initial estimates at the start of earnings season for a more modest 2.57 percent increase. Fundamentals drive long-term market performance, so the sustained earnings growth was a positive sign for businesses and investors.
Technical factors also ended the month mostly supportive, with both the S&P 500 and DJIA ending above their 200-day moving averages. This is the second straight month that the DJIA finished above trend and the first time that the S&P 500 has ended a month above trend since March 2022. The Nasdaq, on the other hand, finished November below its 200-day moving average, as it has every month this year. The 200-day moving average is a widely monitored technical signal since prolonged breaks above or below this trendline can signal shifting investor sentiment for an index. While it’s too early to say that technical support for U.S. markets is back and here to stay, the positive results for both indices were encouraging.
The story was even better internationally, as both developed and emerging market equities rallied in November. The MSCI EAFE Index gained 11.26 percent, marking two consecutive months with positive returns for developed markets. The MSCI Emerging Markets Index had an even better month, with the index showing a 14.85 percent return. Despite positive results, both indices remained well below their respective 200-day moving averages, signaling lingering investor concerns about international stocks.
Fixed income markets also had a positive month, driven by falling long-term interest rates. The 10-year U.S. Treasury yield fell from 4.07 percent at the start of November to 3.68 percent by month-end. The fall in yields helped drive the Bloomberg U.S. Aggregate Bond index to a 3.68 percent return.
High-yield bonds, which are typically less impacted by movements in interest rates and more closely aligned with equities, were also up in November. The Bloomberg U.S. High Yield Corporate Bond index gained 2.17 percent while high-yield credit spreads were largely unchanged.
Inflation Slows but Fed Remains Vigilant
High levels of inflation and the Fed’s tighter monetary policy have been major factors of market turbulence this year, and we saw signs in November that the Fed’s efforts to combat rising prices are starting to succeed. Reports showed encouraging signs that inflation has started to slow in the fourth quarter, although inflation stays high on a year-over-year basis. Multiple Fed officials have noted that the central bank is exploring slowing the pace of its rate hikes at future meetings, highlighted by Fed Chair Jerome Powell’s comments at month-end regarding the Fed potentially hiking the federal funds rate 50 basis points (bps)—following four consecutive 75 bps rate hikes— at its December meeting.
Markets reacted to the news positively, with equities staging a late-month rally following Powell’s comments. Although improvements on the inflation front and softer language from the Fed were encouraging, the Fed is closely monitoring the situation and will be dependent on data in the short term when it comes to setting monetary policy. Given the still high levels of inflation on a year-over-year basis, we may continue to see some short-term, inflation-driven volatility in the months ahead. Progress in November, however, was encouraging.
Consumer and Business Spending Growth Improves
Despite the slowdown in inflationary pressure caused in part by tighter monetary policy, most other economic data releases during the month showed ongoing economic growth. October’s job report showed that 261,000 jobs were added, well above the 193,000 that were expected. While this was down from the 319,000 jobs added in September, it still represents a strong month of job growth on a historical basis and a healthy job market.
The strong labor market helped support consumer spending growth, with retail sales and personal spending showing solid improvements in October. The 1.3 percent increase in headline retail sales was the best result since February, which highlights the strength of the American consumer.
Business spending also showed signs of improvement during the month. Durable goods orders increased 1 percent in October, well above economist estimates for a 0.4 percent increase. Core durable goods orders, which strip out the impact of volatile transportation orders, also increased more than expected. Core durable goods orders are often viewed as a proxy for business investment, so these strong results indicate that businesses continued to spend and invest in October.
Housing Remains Soft
Despite positive results for most areas of the economy, the housing sector showed signs of cooling in November. The pace of existing home sales fell to an annualized rate of 4.43 million in October—the lowest level since Covid-19 pandemic lockdowns in 2020—and well below the 2022 high of 6.49 million that we saw in January.
Still high mortgage rates, limited supply of homes for sale, and high prices continued to serve as headwinds for the housing sector, although we did see a modest decline in mortgage rates by month-end. Homebuilder confidence and new home construction also showed signs of a slowdown in November, with the drop in prospective home buyer demand giving homebuilders pause.
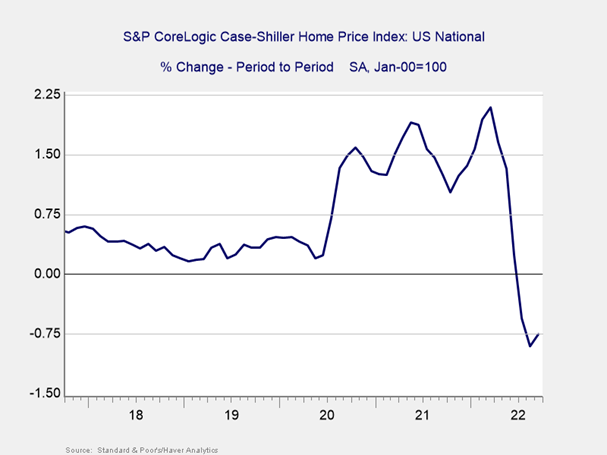
Housing costs are one of the major factors of inflation and the housing sector slowdown has caused prices to start to fall after rising notably throughout 2020 and 2021. As you can see in Figure 1, September marked three consecutive months with declining house prices, which is bad news for prospective sellers but an encouraging sign for the Fed while it tries to combat inflation.
Figure 1. S&P CoreLogic Case-Shiller Home Price Index, Oct. 2017–Present
Positive Outlook Despite Risks
While November brought positive results for markets and the economy, it’s important to remember that real risks to both remain. The fight against inflation isn’t over, as evidenced by still-high price growth on a year-over-year basis, and the potential for a rise in inflationary pressure and tighter monetary policy from the Fed exists in the short term. Additionally, while the conclusion of the midterm elections helped remove some political uncertainty during the month, a divided government could lead to further political turbulence in the new year, especially if we see another debt ceiling debate emerge.
Abroad, the continuous Russian invasion of Ukraine is a constant source of uncertainty. While the direct market impact of the war has largely faded at this point, an increase in hostilities could lead to further instability. The slowdown in China due to its zero-Covid policies is another factor that should be monitored given the importance of the country for global trade.
While none of these factors are expected to become immediate concerns for investors, any of them could negatively impact markets in the short term and further volatility is certainly possible. Despite these risks, however, the continued positive fundamental backdrop is encouraging.
The U.S. economy still shows signs of growth, with the strong job market and resilient consumer and business spending beating expectations. Fundamentals should help limit downside potential, which we’ve seen for markets over the past two months.
Ultimately, while risks remain, the outlook is positive; many of the risks have either diminished or been priced into markets at this point. The most likely path ahead is for continued growth and market appreciation, although the path and pace of further improvements is ambiguous. Given the short-term uncertainty, a well-diversified portfolio that aligns with investment goals and timelines is the best path forward for most. As always, reach out to your financial advisor to discuss your financial plan if you have questions or concerns.
All information according to Bloomberg, unless stated otherwise.
Disclosure: Certain sections of this commentary contain forward-looking statements based on our reasonable expectations, estimates, projections, and assumptions. Forward-looking statements are not guarantees of future performance and involve certain risks and uncertainties, which are difficult to predict. Past performance is not indicative of future results. Diversification does not assure a profit or protect against loss in declining markets. All indices are unmanaged and investors cannot invest directly into an index. The Dow Jones Industrial Average is a price-weighted average of 30 actively traded blue-chip stocks. The S&P 500 Index is a broad-based measurement of changes in stock market conditions based on the average performance of 500 widely held common stocks. The Nasdaq Composite Index measures the performance of all issues listed in the Nasdaq Stock Market, except for rights, warrants, units, and convertible debentures. The MSCI EAFE Index is a float-adjusted market capitalization index designed to measure developed market equity performance, excluding the U.S. and Canada. The MSCI Emerging Markets Index is a market capitalization-weighted index composed of companies representative of the market structure of 26 emerging market countries in Europe, Latin America, and the Pacific Basin. It excludes closed markets and those shares in otherwise free markets that are not purchasable by foreigners. The Bloomberg Aggregate Bond Index is an unmanaged market value-weighted index representing securities that are SEC-registered, taxable, and dollar-denominated. It covers the U.S. investment-grade fixed-rate bond market, with index components for a combination of the Bloomberg government and corporate securities, mortgage-backed pass-through securities, and asset-backed securities. The Bloomberg U.S. Corporate High Yield Index covers the USD-denominated, non-investment-grade, fixed-rate, taxable corporate bond market. Securities are classified as high-yield if the middle rating of Moody’s, Fitch, and S&P is Ba1/BB+/BB+ or below.
Mark Gallagher is a financial advisor located at Gallagher Financial Services at 2586 East 7th Ave. Suite #304, North Saint Paul, MN 55109. He offers securities and advisory services as an Investment Adviser Representative of Commonwealth Financial Network®, Member FINRA/SIPC, a Registered Investment Adviser. He can be reached at 651-774-8759 or at mark@markgallagher.com
Authored by the Investment Research team at Commonwealth Financial Network.
© 2022 Commonwealth Financial Network®