Presented by Mark Gallagher
Markets hit turbulence in May
After four months of rising stock markets, we finally saw a decline in May. All three major U.S. markets ended the month down, driven by rising worries about a trade war. The S&P 500 declined by 6.35 percent during the month, the Nasdaq Composite lost 7.79 percent, and the Dow Jones Industrial Average fell by 6.32 percent. Of course, this pullback is a concern. But in the bigger picture, it has taken markets back only to mid-March levels. They are still well above where we started the year, so there is no need to panic yet.
The pullback was due to declining confidence, as fundamentals improved during the month. According to FactSet (as of May 24, 2019), with 97 percent of companies reporting, the first-quarter blended earnings growth rate for the S&P 500 stands at –0.4 percent. If this number comes in as expected, it would be the first quarter of year-over-year earnings declines since the second quarter of 2016. On first glance, this may seem like bad news. But it is much better than the 4 percent drop forecast on March 31, or even the 2.3 percent drop expected at the start of May. Plus, analysts expect earnings growth to be positive for the rest of the year. This growth should help bolster equity performance going forward.
Although fundamentals were supportive during the month, technical factors were another story. All three major U.S. indices ended May below their respective 200-day moving averages. In fact, the S&P 500 and Nasdaq dropped below the trend line on the last day of the month. This drop is a warning signal for U.S. markets. A prolonged dip below the 200-day moving average can indicate deteriorating investor sentiment and serve as a headwind for future performance.
The international story was much the same, as global trade concerns affected markets across the world. The MSCI EAFE Index fell by 4.80 percent during the month, and the MSCI Emerging Markets Index declined by 7.22 percent. Here again, technical factors were not supportive. Both indices spent most of May below their respective trend lines.
This was an especially disappointing month for developed international markets. The MSCI EAFE Index spent April above its 200-day moving average. This marked the first full month above the trend line for the index in more than a year. But the move below the trend line in May indicates that investors are still cautious about international investing.
Fixed income markets had a better month than equities. Here, investors rotated away from riskier asset classes and into investment-grade bonds. Yields fell during the month, with the 10-year Treasury falling from 2.52 percent to 2.22 percent. This drop led the Bloomberg Barclays U.S. Aggregate Bond Index to a gain of 1.78 percent in May, as bond values typically increase when rates drop.
High-yield fixed income had a challenging month. This space is less driven by rate movements and more correlated with equities. In May, risk-averse investors favored higher-quality sectors of the fixed income market. The Bloomberg Barclays U.S. Corporate High-Yield Index declined by 1.19 percent during the month.
Economic data a mixed bag
The economic data released in May was a mixed bag. We saw improvements in consumer sentiment and spending. But we also saw lowered business optimism and investment amid concerns over the ongoing trade wars. Despite the varying results, the economy continued to show growth.
Consumers were the major bright spot during the month. Rising confidence led to increased spending. The University of Michigan consumer confidence survey hit a 15-year high at midmonth before moderating at month’s end. Plus, the Conference Board’s measurement of consumer confidence showed better-than-expected improvement.
Solid employment results helped bolster consumer sentiment. The 236,000 new jobs added in April drove the unemployment rate down to a 50-year low of 3.6 percent. Wage growth also remained healthy, with a 3.2 percent year-over-year increase.
Rising consumer confidence led to better-than-expected spending growth. Personal spending rose by 0.3 percent in April. This increase was supported by 0.5 percent growth in personal income over the same period. To be sure, consumer spending is very important to the economy. As such, it will be important to watch whether improvements in confidence can continue to translate into more spending.
Businesses feel weight of the trade wars
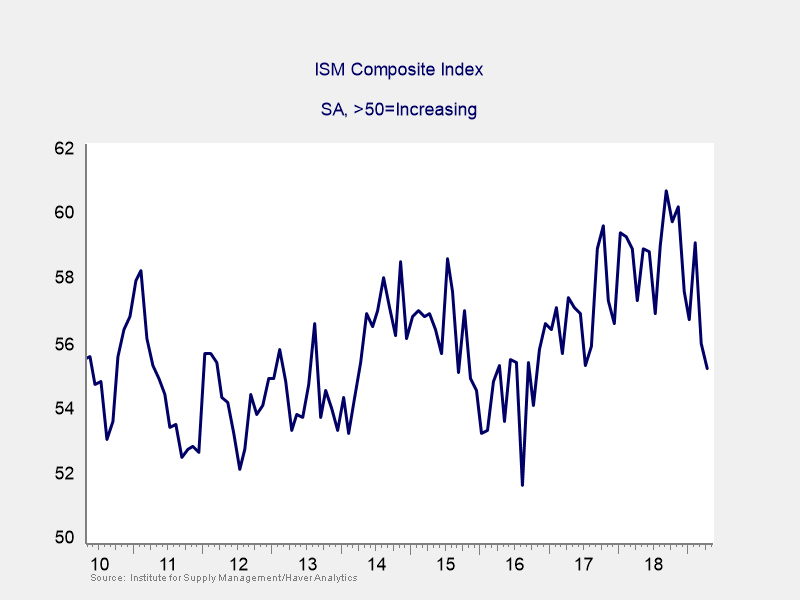
Worries over trade wars with China and Mexico drove much of the negative data released in May. Businesses especially began to feel the effect of these continued trade disputes. The Institute for Supply Management (ISM) Manufacturing and Nonmanufacturing indices both fell during the month. As a result, the ISM composite index of business sentiment dropped to its lowest level since October 2016 (see Figure 1).
Figure 1. ISM Composite Index, May 2010–April 2019
Declines in business sentiment were echoed by decreased business investment. Durable goods orders in April fell by 2.1 percent, which was worse than expected. Revisions to March’s orders also showed weakness. The slide in April was due to a decline in aircraft purchases. Industrial production also disappointed. Lowered utility production and a drop in manufacturing led to an overall decline of 0.5 percent.
Net international trade, which was a surprise tailwind for first-quarter growth, reversed course. The trade deficit widened from $49.4 billion to $50 billion in March. This increase was driven by imports increasing faster than exports. Economists expect that this deficit widened further in April, as the escalating U.S.-China trade war likely slowed export growth.
As mentioned, May’s data had mixed results. But the improvement in consumer sentiment and spending is likely to outweigh the concerns around the business sector. Here, it is important to note that consumer spending makes up more than two-thirds of the economy. Despite the trade-related headwinds in the business sector, improvement in spending should help keep growth going.
Economy withstands rising political risks
As we have seen time and again, political risks can have a direct effect on markets. They generate uncertainty and, therefore, short-term volatility. In fact, political risks drove much of the instability across markets in May. Here, the escalation of the U.S.-China trade war and the surprise announcement of a 5 percent tariff on all Mexican goods were the main culprits.
Developments in May gave rise to a heightened level of worry. Now, markets are priced for more bad news. This pricing sets them up for more declines if the trade situation deteriorates. It also creates an opportunity for a recovery if tensions ratchet down. Of course, there is no telling what will happen with trade developments over the next few months. But the fundamentals suggest growth will continue. This growth should help support markets and provide the foundation for a recovery if the trade tensions do resolve.
Big picture remains positive
Last month’s decline reminds us that although market volatility can create pain in the short term, the big picture in the U.S. remains positive. Consumers continue to be confident and willing to spend. These factors should help boost growth throughout the year. Companies are expected to show improving fundamentals. Finally, even with the declines seen in equities, markets are still positive year-to-date and remain well above December lows.
There are risks out there, especially politically. Nonetheless, the U.S. remains economically resilient and continues to show signs of growth. All in all, May was a bad month for markets. But it is quite possible that it was just that—a bad month—and not the beginning of a larger negative trend.
As always, a well-diversified portfolio and a long-term view toward investing remain the best way to meet financial goals in an unpredictable world.
All information according to Bloomberg, unless stated otherwise.
Disclosure: Certain sections of this commentary contain forward-looking statements based on our reasonable expectations, estimates, projections, and assumptions. Forward-looking statements are not guarantees of future performance and involve certain risks and uncertainties, which are difficult to predict. Past performance is not indicative of future results. Diversification does not assure a profit or protect against loss in declining markets. All indices are unmanaged and investors cannot invest directly into an index. The Dow Jones Industrial Average is a price-weighted average of 30 actively traded blue-chip stocks. The S&P 500 Index is a broad-based measurement of changes in stock market conditions based on the average performance of 500 widely held common stocks. The Nasdaq Composite Index measures the performance of all issues listed in the Nasdaq Stock Market, except for rights, warrants, units, and convertible debentures. The MSCI EAFE Index is a float-adjusted market capitalization index designed to measure developed market equity performance, excluding the U.S. and Canada. The MSCI Emerging Markets Index is a market capitalization-weighted index composed of companies representative of the market structure of 26 emerging market countries in Europe, Latin America, and the Pacific Basin. It excludes closed markets and those shares in otherwise free markets that are not purchasable by foreigners. The Bloomberg Barclays Aggregate Bond Index is an unmanaged market value-weighted index representing securities that are SEC-registered, taxable, and dollar-denominated. It covers the U.S. investment-grade fixed-rate bond market, with index components for a combination of the Bloomberg Barclays government and corporate securities, mortgage-backed pass-through securities, and asset-backed securities. The Bloomberg Barclays U.S. Corporate High Yield Index covers the USD-denominated, non-investment-grade, fixed-rate, taxable corporate bond market. Securities are classified as high-yield if the middle rating of Moody’s, Fitch, and S&P is Ba1/BB+/BB+ or below.
Mark Gallagher is a financial advisor located at Gallagher Financial Services at 2586 East 7th Ave. Suite #304, North Saint Paul, MN 55109. He offers securities and advisory services as an Investment Adviser Representative of Commonwealth Financial Network®, Member FINRA/SIPC, a Registered Investment Adviser. He can be reached at 651-774-8759 or at mark@markgallagher.com.
Authored by Brad McMillan, CFA®, CAIA, MAI, managing principal, chief investment officer, and Sam Millette, fixed income analyst, at Commonwealth Financial Network®.
© 2019 Commonwealth Financial Network ®