Presented by Mark Gallagher
A positive month for markets
August was another strong month for financial markets. The S&P 500 and Nasdaq Composite both set all-time highs, gaining 7.19 percent and 9.70 percent, respectively. The Dow Jones Industrial Average (DJIA), which has been slower to recover from pandemic-induced volatility earlier in the year, gained a strong 7.92 percent. This brought the index into positive territory year-to-date.
These results were supported by better-than-expected fundamentals during the month. According to Bloomberg Intelligence, with 91 percent of companies having reported, the blended earnings decline for the S&P 500 was 32.8 percent in the second quarter. This is an improvement from initial estimates for a 43.6 percent decline. Companies largely came in above expectations during the quarter, with 82 percent of reporting companies beating earnings estimates. These results, combined with analyst expectations for a return to earnings growth early in 2021, show that companies were able to withstand the economic disruption caused by anticoronavirus measures in the second quarter better than expected.
Technical factors were also supportive during the month. All three major U.S. equity indices spent the month well above their respective 200-day moving averages. This marks two straight months with all three indices finishing above trend. The technical support for the DJIA was especially notable. This was the first month since January where the index spent the entire month above its trendline. The 200-day moving average is a widely followed technical indicator, as sustained breaks above or below trend can signal a change in investor sentiment for an index.
The story was much the same internationally. The MSCI EAFE Index returned 5.14 percent during the month. The MSCI Emerging Markets Index lagged slightly, returning 2.24 percent, as late-month volatility dampened returns. Technicals for emerging and developed markets were supportive in August, and both indices spent the month above trend. This marks the second month in a row where emerging markets have been supported technically. The MSCI EAFE Index fell briefly below trend at the end of July before rebounding swiftly in August.
Fixed income markets had a more challenging month, as rising long-term interest rates weighed on returns. The 10-year Treasury yield started the month at 0.56 percent and rose to 0.72 percent by the end of August. This increase brought long-term yields up to levels last seen in June, but yields remain low on a historical basis. The Bloomberg Barclays U.S. Aggregate Bond Index lost 0.81 percent during the month.
High-yield bonds, which are typically less tied to moves in interest rates and more closely correlated with the equity market, had a more encouraging month. The Bloomberg Barclays U.S. Corporate High Yield Index gained a respectable 0.95 percent in August. High-yield spreads continued to narrow, as investors showed a growing appetite to accept lower yields for relatively riskier fixed income assets.
Public health picture improves
We saw continued progress in slowing the spread of the coronavirus in August. This indicates that measures to combat rising case numbers in July have started to pay off. On a national level, the daily spread rate was roughly 0.7 percent at month-end. This is a significant improvement compared with mid-July, when the spread rate spiked above 2 percent. While new cases per day are up compared with early June’s numbers, we’ve seen progress in lowering new daily cases and even signs of stabilization in total active cases.
Testing disappointed during the month, though. The average number of daily new tests fell by more than 9 percent in the final week of August compared with the last week of July. At these testing levels, we do not have enough daily tests to get a full picture of the pandemic. The positive test ratio, which measures the percentage of tests per day that come back positive, averaged 6.6 percent. This is higher than the World Health Organization’s recommended 5 percent level.
While there was some encouraging progress made on the public health front during the month, there is still more work to be done. The fact that we continued to make progress in August provides some comfort that we are on the right path. But it will be an ongoing effort to contain the coronavirus, and we will likely face setbacks along the way. Looking forward, all eyes will be on efforts to reopen schools, as this represents a clear health risk.
Economic recovery slowing but still growing
The economy continued to rebound in August, but there are signs that the boost provided by reopening efforts and government stimulus earlier in the summer has started to weaken. Economists have monitored July’s consumer spending data to see whether the rebound in spending we saw in May and June would withstand the headwinds created by rising case counts and falling consumer confidence in July. Retail sales and personal spending both increased during the month but at a much slower rate than in May and June. Although the continued growth in consumer spending we saw in July was welcome, the slowdown is a potential cause for concern given the importance of consumer spending for the economy.
One of the drivers of slower consumer spending in July was lowered consumer confidence. Both major measures of consumer confidence fell in July. The Conference Board Consumer Confidence Index fell in August as well, bringing it to a six-year low. Continued challenges for the labor market and concerns about the pace of economic growth weighed on consumers’ minds early in the month. There were signs that confidence started to improve by month-end, however. The University of Michigan consumer sentiment survey showed a moderate increase in confidence between the initial estimate midmonth and the final report at the end of August. Although the drop in the Conference Board’s measure was concerning, the improvement we saw in the University of Michigan survey later in the month was a positive signal that confidence may have bottomed and started to recover.
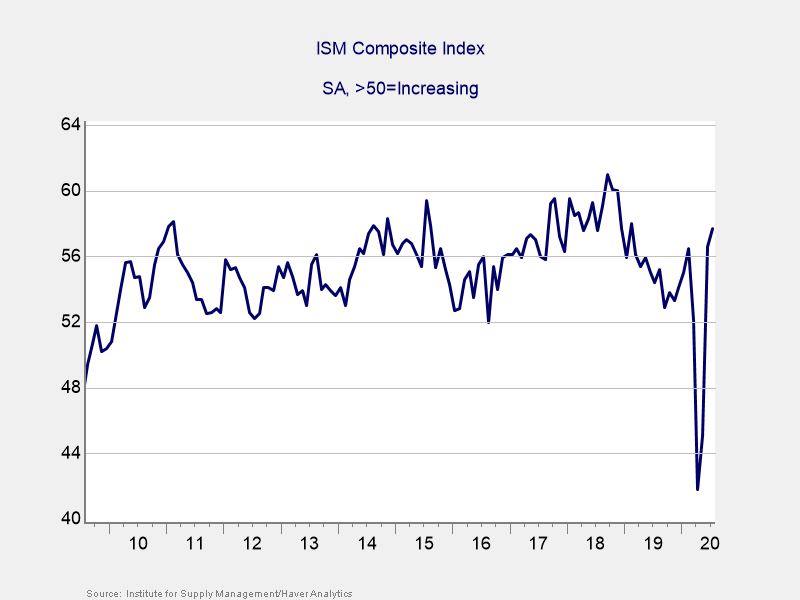
Despite the mixed results for consumer confidence and spending, businesses performed well. Business confidence, as measured by the Institute for Supply Management (ISM) Composite index, increased in July to its highest level in more than a year, as you can see in Figure 1.
Figure 1. ISM Composite Index, 2009–Present
Businesses also showed they were willing and able to spend during the month. July’s durable goods orders report blew past expectations, rising by 11.2 percent against calls for a 4.8 percent increase. Core durable goods sales, which strip out the impact of volatile transportation orders and are often used as a proxy for business investment, also grew by more than expected. These strong results, combined with higher-than-expected levels of manufacturing output and new home construction, give a reason to hope for strong business investment during the quarter.
Risks remain, but outlook is modestly optimistic
We saw many signs of continued improvement in public health and the economy in August, but very real risks remain. School reopening efforts will likely draw the majority of the attention, especially if we start to see case numbers rise in student populations. Lower federal unemployment support is expected to serve as a barrier to future spending growth. While the path forward most likely points to continued growth, the hopes of an ongoing recovery rely largely on consumer improvements.
There are also external risks that should be monitored. These include worsening U.S.-China trade relations, social unrest, and the upcoming elections. Each has the potential to cause additional market turbulence.
We are in a better place than we were a month ago, but markets are pricing in continued steady improvements, which could lead to additional volatility if these expectations aren’t met. A well-diversified portfolio that matches investor timelines and goals is the best path forward for most. If concerns remain, a discussion with your financial advisor can help as you navigate these uncertain times.
All information according to Bloomberg, unless stated otherwise.
Disclosure: Certain sections of this commentary contain forward-looking statements based on our reasonable expectations, estimates, projections, and assumptions. Forward-looking statements are not guarantees of future performance and involve certain risks and uncertainties, which are difficult to predict. Past performance is not indicative of future results. Diversification does not assure a profit or protect against loss in declining markets. All indices are unmanaged and investors cannot invest directly into an index. The Dow Jones Industrial Average is a price-weighted average of 30 actively traded blue-chip stocks. The S&P 500 Index is a broad-based measurement of changes in stock market conditions based on the average performance of 500 widely held common stocks. The Nasdaq Composite Index measures the performance of all issues listed in the Nasdaq Stock Market, except for rights, warrants, units, and convertible debentures. The MSCI EAFE Index is a float-adjusted market capitalization index designed to measure developed market equity performance, excluding the U.S. and Canada. The MSCI Emerging Markets Index is a market capitalization-weighted index composed of companies representative of the market structure of 26 emerging market countries in Europe, Latin America, and the Pacific Basin. It excludes closed markets and those shares in otherwise free markets that are not purchasable by foreigners. The Bloomberg Barclays Aggregate Bond Index is an unmanaged market value-weighted index representing securities that are SEC-registered, taxable, and dollar-denominated. It covers the U.S. investment-grade fixed-rate bond market, with index components for a combination of the Bloomberg Barclays government and corporate securities, mortgage-backed pass-through securities, and asset-backed securities. The Bloomberg Barclays U.S. Corporate High Yield Index covers the USD-denominated, non-investment-grade, fixed-rate, taxable corporate bond market. Securities are classified as high-yield if the middle rating of Moody’s, Fitch, and S&P is Ba1/BB+/BB+ or below.
Mark Gallagher is a financial advisor located at Gallagher Financial Services at 2586 East 7th Ave. Suite #304, North Saint Paul, MN 55109. He offers securities and advisory services as an Investment Adviser Representative of Commonwealth Financial Network®, Member FINRA/SIPC, a Registered Investment Adviser. He can be reached at 651-774-8759 or at mark@markgallagher.com.
Authored by Brad McMillan, CFA®, CAIA, MAI, managing principal, chief investment officer, and Sam Millette, senior investment research analyst, at Commonwealth Financial Network®.
© 2020 Commonwealth Financial Network®