Market Update for the Week of March 18, 2024

Presented by Mark Gallagher

Facing greater exposure to debt—which costs more as rates increase—small-cap stocks struggled last week. Rates rose as bond investors demanded more yield to offset hotter-than-expected inflation.

Quick Hits

  1. Report releases: Consumer and producer prices were hotter than expected in February.
  2. Financial market data: Small-caps struggled as inflation led to potential challenges via
    floating rate debt.
  3. Looking ahead: All eyes will be on the Federal Open Market Committee (FOMC) for its
    March rate decision.

Report Releases—March 11–15, 2024

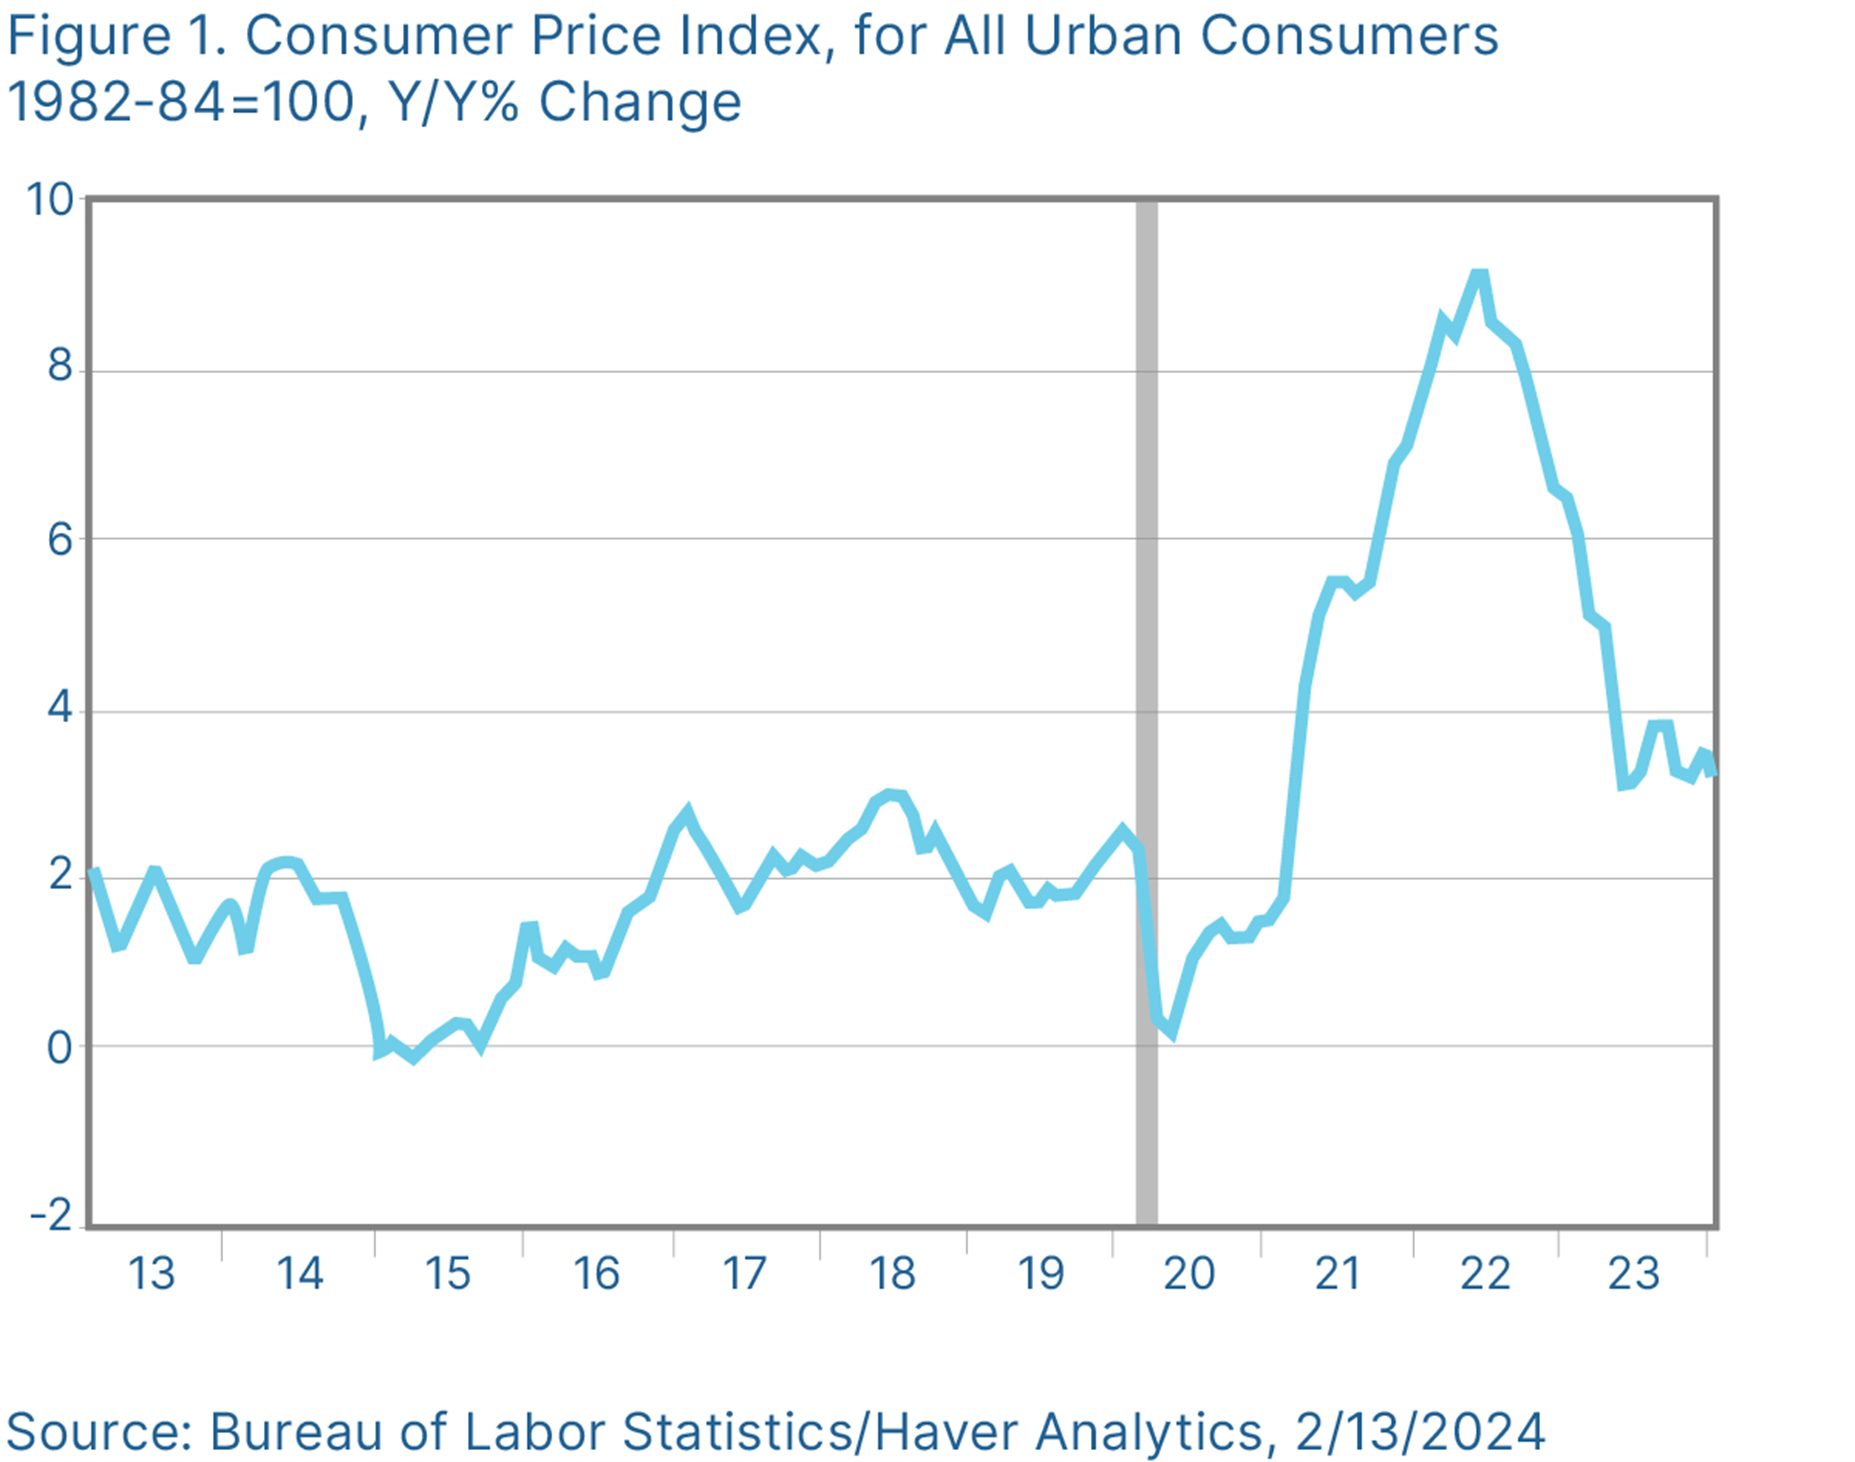
Consumer Price Index (CPI): February (Tuesday)

Headline and core consumer inflation accelerated in February, with year-over-year consumer inflation ticking up to 3.2 percent. Rising costs for shelter, gas, and used cars contributed to the rise.

-Prior monthly CPI/core CPI growth: +0.3%/+0.4%

-Expected monthly CPI/core CPI growth: +0.4%/+0.3%

-Actual monthly CPI/core CPI growth: +0.4%/+0.4%

-Prior year-over-year CPI/core CPI growth: +3.1%/+3.9%

-Expected year-over-year CPI/core CPI growth: +3.1%/+3.7%

-Actual year-over-year CPI/core CPI growth: +3.2%/+3.8%

Retail Sales: February (Thursday)

Retail sales rose in February, though the 0.6 percent increase was below economist forecasts. This lackluster result followed a downwardly revised 1.1 percent sales drop in January.

-Expected/prior month retail sales monthly change: +0.8%/–1.1%

-Actual retail sales monthly change: +0.6%

Producer Price Index (PPI): February (Thursday).

Producer prices rose more than expected in February, with the 0.6 percent rise in headline prices marking the largest monthly increase since August 2023.

-Prior monthly PPI/core PPI growth: +0.3%/+0.5%

-Expected monthly PPI/core PPI growth: +0.3%/+0.2%

-Actual monthly PPI/core PPI growth: +0.6%/+0.3%

-Prior year-over-year PPI/core PPI growth: +1%/+2%

-Expected year-over-year PPI/core PPI growth: +1.2%/+1.9%

-Actual year-over-year PPI/core PPI growth: +1.6%/+2%

Preliminary University of Michigan Consumer Sentiment Survey: March (Friday)
Consumer sentiment dipped slightly against calls for a modest increase from February’s reading.
The decrease was driven by consumer outlook for future economic conditions; sentiment around current conditions held steady.

-Expected/prior month consumer sentiment survey: 77.1/76.9

-Actual consumer sentiment survey: 76.5

The Takeaway

-Consumer and producer inflation rose more than expected in February.

-Retail sales and consumer sentiment were lower than expected.

Financial Market Data

Equity

Index Week-to-Date Month-to-Date Year-to-Date 12-Month
S&P 500 –0.09% 0.48% 7.63% 31.26%
Nasdaq Composite –0.68% –0.70% 6.58% 37.41%
DJIA 0.01% –0.60% 3.22% 22.61%
MSCI EAFE –1.32% 1.92% 4.38% 20.16%
MSCI Emerging Markets –0.12% 1.49% 1.38% 12.84%
Russell 2000 –2.02% –0.65% 0.89% 16.95%

Source: Bloomberg, as of March 15, 2024

The Nasdaq Composite fell for the second straight week. The Russell 2000 and small-caps led the way downward. Tesla and Meta Platforms were the primary detractors from the “Magnificent Seven.” Each was down more than 4 percent. Semiconductors and airlines were among other laggards. Airlines were led lower after Southwest said it would cut 2024 capacity amid weakness in leisure spending. Energy, materials, and consumer staples were among the top-performing sectors. West Texas Intermediate crude oil was up more than 4 percent.

Fixed Income

Index Month-to-Date Year-to-Date 12-Month
U.S. Broad Market –0.04% –1.72% 1.63%
U.S. Treasury –0.25% –1.84% –0.12%
U.S. Mortgages 0.01% –2.07% 0.80%
Municipal Bond 0.34% –0.04% 4.22%

Source: Bloomberg, as of March 15, 2024

On the back of hotter-than-expected inflation data, Treasuries sold off heavily in the belly of the curve. The 5-year yield rose more than 26 basis points (bps), closing the week at 4.32 percent. Fixed income investors demanded more yield as inflation continued to take bites out of fixed coupon payments.

The Takeaway

-Semiconductors took a breather and airlines showed signs of weakening demand.

-Yields rose sharply in the belly of the curve as inflation was hotter than expected.

Looking Ahead

All eyes will be on the FOMC this week as Federal Reserve (Fed) Chair Jerome Powell and peers deliver their March rate decision. Several housing indicators will bookend Wednesday’s rate decision.

-The week kicks off on Monday with the release of the National Association of Home Builders Housing Market Index for March. Home builder confidence is expected to remain unchanged after reaching a six-month high in February.

-On Tuesday, we expect the release of housing starts and building permits for February. Economists expect both to rebound after falling more than expected in January.

-The primary focus this week is on the FOMC rate decision for March, expected at 2:00 p.m. ET on Wednesday. The Fed is expected to leave the federal funds rate unchanged. Economists and investors will closely watch the post-meeting news release, along with Powell’s post-meeting news conference, for potential guidance on the path of monetary policy.

-On Friday, the week wraps with existing home sales data for February. Existing home sales are expected to fall after improving more than expected to start the year. High prices, still-high mortgage rates, and a lack of supply are expected to serve as headwinds.

Disclosures: This material is intended for informational/educational purposes only and should not be construed as investment advice, a solicitation, or a recommendation to buy or sell any security or investment product. Please contact your financial professional for more information specific to your situation.

Certain sections of this commentary contain forward-looking statements that are based on our reasonable expectations, estimates, projections, and assumptions. Forward-looking statements are not guarantees of future performance and involve certain risks and uncertainties, which are difficult to predict. All indices are unmanaged and are not available for direct investment by the public. Past performance is not indicative of future results. The S&P 500 is based on the average performance of the 500 industrial stocks monitored by Standard & Poor’s. The Nasdaq Composite Index measures the performance of all issues listed in the Nasdaq Stock Market, except for rights, warrants, units, and convertible debentures. The Dow Jones Industrial Average is computed by summing the prices of the stocks of 30 large companies and then dividing that total by an adjusted value, one which has been adjusted over the years to account for the effects of stock splits on the prices of the 30 companies. Dividends are reinvested to reflect the actual performance of the underlying securities. The MSCI EAFE Index is a float-adjusted market capitalization index designed to measure developed market equity performance, excluding the U.S. and Canada. The MSCI Emerging Markets Index is a market capitalization-weighted index composed of companies representative of the market structure of 26 emerging market countries in Europe, Latin America, and the Pacific Basin. The Russell 2000® Index measures the performance of the 2,000 smallest companies in the Russell 3000® Index. The Bloomberg US Aggregate Bond Index is an unmanaged market value-weighted performance benchmark for investment-grade fixed-rate debt issues, including government, corporate, asset-backed, and mortgage-backed securities with maturities of at least one year. The U.S. Treasury Index is based on the auctions of U.S. Treasury bills, or on the U.S. Treasury’s daily yield curve. The Bloomberg US Mortgage Backed Securities (MBS) Index is an unmanaged market value-weighted index of 15- and 30-year fixed-rate securities backed by mortgage pools of the Government National Mortgage Association (GNMA), Federal National Mortgage Association (Fannie Mae), and the Federal Home Loan Mortgage Corporation (FHLMC), and balloon mortgages with fixed-rate coupons. The Bloomberg US Municipal Index includes investment-grade, tax-exempt, and fixed-rate bonds with long-term maturities (greater than 2 years) selected from issues larger than $50 million. One basis point is equal to 1/100th of 1 percent, or 0.01 percent.

Mark Gallagher is a financial advisor located at Gallagher Financial Services at 2586 East 7th Ave. Suite #304, North Saint Paul, MN 55109. He offers securities and advisory services as an Investment Adviser Representative of Commonwealth Financial Network®, Member FINRA/SIPC, a Registered Investment Adviser. He can be reached at 651-774-8759 or at mark@markgallagher.com

Authored by the Investment Research team at Commonwealth Financial Network.

© 2024 Commonwealth Financial Network


Weekly Market Update, March 11, 2024

Market Update—Week of March 11, 2024
Presented by Mark Gallagher

Weak iPhone and Tesla sales in China moved the Nasdaq Composite lower. Rates for Treasuries with maturities greater than five years fell as the Federal Reserve (Fed) indicated it was close to cutting interest rates.

Quick Hits

  1. Report releases: Hiring accelerated in February, with a strong 275,000 jobs added during the month.
  2. Financial market data: Weak iPhone and Tesla sales in China helped send the Nasdaq lower.
  3. Looking ahead: Inflation reports (consumer inflation on Tuesday and producer inflation on Thursday) will be the primary focus this week.

Keep reading for an in-depth look.

Report Releases—March 4–8, 2024

ISM Services Index: February (Tuesday)

Service sector confidence fell more than expected in February, due in part to a slowdown in service sector employment. Despite the decline, the index remained in expansionary territory.

– Expected/prior ISM Services index: 53/53.4

– Actual ISM Services index: 52.6

Job Openings and Labor Turnover Survey (JOLTS): January (Wednesday)

Job openings were almost exactly in line with expectations as the pace of the decline in openings continued to moderate.

– Expected job openings/prior job openings: 8,862,000/9,026,000

– Actual job openings: 8,863,000

Trade Balance: January (Thursday).

The trade deficit increased more than expected in January, due to a 1.1 percent rise in imports that overwhelmed a 0.1 percent rise in exports.

– Expected/prior trade deficit: –$63.5 billion/–$64.2 billion

– Actual trade deficit: –$67.4 billion

Employment Report: February (Friday)
Hiring accelerated in February, with 275,000 new jobs added following a downwardly revised 229,000 jobs in January. Although headline job growth remained strong, the unemployment rate ticked up, from 3.7 percent to 3.9 percent.

– Expected/prior change in nonfarm payrolls: +200,000/+229,000

– Actual change in nonfarm payrolls: +275,000

The Takeaway

– Confidence in the service sector softened a bit more than expected in February.

– Hiring was stronger than expected in February, and the decline in job openings continued to moderate in January.

Financial Market Data

Equity

Index Week-to-Date Month-to-Date Year-to-Date 12-Month
S&P 500 –0.23% 0.58% 7.73% 32.86%
Nasdaq Composite –1.15% –0.02% 7.31% 43.01%
DJIA –0.85% –0.61% 3.21% 22.65%
MSCI EAFE 2.47% 3.28% 5.78% 17.43%
MSCI Emerging Markets 1.24% 1.62% 1.51% 9.96%
Russell 2000 0.34% 1.40% 2.97% 15.83%

Source: Bloomberg, as of March 8, 2024

The tech-oriented Nasdaq Composite led the way down, with Apple and Tesla the main drivers. Apple was fined $2 billion by the European Union and is under continued scrutiny for how it has worked with Epic Games. It was also reported that the company’s iPhone sales in China fell 24 percent in the first six weeks of the year as consumers shifted to Chinese-based phones such as Huawei. Tesla fell more than 13 percent as demand in China waned and suspected arson shut down its German factory.

Fixed Income

Index Month-to-Date Year-to-Date 12-Month
U.S. Broad Market 1.21% –0.50% 4.70%
U.S. Treasury 1.01% –0.60% 3.29%
U.S. Mortgages 1.55% –0.57% 4.29%
Municipal Bond 0.41% 0.03% 5.61%

Source: Bloomberg, as of March 8, 2024

Treasuries with maturities greater than five years rallied as investors took a risk-off sentiment from equities and Fed Chairman Jerome Powell said the central bank was “not far from a level of confidence needed to cut” interest rates. This indicated the Fed may be more confident it has reeled in inflation, which is supportive for bond investors with fixed coupon payments. The U.S. 10-year Treasury declined more than 9 basis points (bps) to close at 4.09 percent.

The Takeaway

– Chinese consumer demand for iPhones and Teslas was weak to start the year.

– Bond investors bought the belly and long end of the curve as the Fed indicated it was close to cutting interest rates.

Looking Ahead

We expect several important economic data releases this week. Inflation reports will be the primary focus, with consumer inflation data due Tuesday and producer inflation statistics expected Thursday.

– The week kicks off Tuesday with the release of the Consumer Price Index (CPI) report for February. Headline consumer inflation is expected to pick up, with economists calling for a 0.4 percent rise in prices after a 0.3 percent increase in January.

– On Thursday, retail sales data and the Producer Price Index (PPI) for February are expected. Retail sales (both headline and core) are set to rebound after falling more than expected in January. Producer inflation is expected to increase 0.3 percent after a 0.3 percent rise in January.

– Finally, Friday will wrap with the preliminary University of Michigan consumer sentiment survey for March. Consumer sentiment is expected to increase modestly after falling more than expected in February.

Disclosures: This material is intended for informational/educational purposes only and should not be construed as investment advice, a solicitation, or a recommendation to buy or sell any security or investment product. Please contact your financial professional for more information specific to your situation.

Certain sections of this commentary contain forward-looking statements that are based on our reasonable expectations, estimates, projections, and assumptions. Forward-looking statements are not guarantees of future performance and involve certain risks and uncertainties, which are difficult to predict. All indices are unmanaged and are not available for direct investment by the public. Past performance is not indicative of future results. The S&P 500 is based on the average performance of the 500 industrial stocks monitored by Standard & Poor’s. The Nasdaq Composite Index measures the performance of all issues listed in the Nasdaq Stock Market, except for rights, warrants, units, and convertible debentures. The Dow Jones Industrial Average is computed by summing the prices of the stocks of 30 large companies and then dividing that total by an adjusted value, one which has been adjusted over the years to account for the effects of stock splits on the prices of the 30 companies. Dividends are reinvested to reflect the actual performance of the underlying securities. The MSCI EAFE Index is a float-adjusted market capitalization index designed to measure developed market equity performance, excluding the U.S. and Canada. The MSCI Emerging Markets Index is a market capitalization-weighted index composed of companies representative of the market structure of 26 emerging market countries in Europe, Latin America, and the Pacific Basin. The Russell 2000® Index measures the performance of the 2,000 smallest companies in the Russell 3000® Index. The Bloomberg US Aggregate Bond Index is an unmanaged market value-weighted performance benchmark for investment-grade fixed-rate debt issues, including government, corporate, asset-backed, and mortgage-backed securities with maturities of at least one year. The U.S. Treasury Index is based on the auctions of U.S. Treasury bills, or on the U.S. Treasury’s daily yield curve. The Bloomberg US Mortgage Backed Securities (MBS) Index is an unmanaged market value-weighted index of 15- and 30-year fixed-rate securities backed by mortgage pools of the Government National Mortgage Association (GNMA), Federal National Mortgage Association (Fannie Mae), and the Federal Home Loan Mortgage Corporation (FHLMC), and balloon mortgages with fixed-rate coupons. The Bloomberg US Municipal Index includes investment-grade, tax-exempt, and fixed-rate bonds with long-term maturities (greater than 2 years) selected from issues larger than $50 million. One basis point is equal to 1/100th of 1 percent, or 0.01 percent.

Mark Gallagher is a financial advisor located at Gallagher Financial Services at 2586 East 7th Ave. Suite #304, North Saint Paul, MN 55109. He offers securities and advisory services as an Investment Adviser Representative of Commonwealth Financial Network®, Member FINRA/SIPC, a Registered Investment Adviser. He can be reached at 651-774-8759 or at mark@markgallagher.com

Authored by the Investment Research team at Commonwealth Financial Network.

© 2024 Commonwealth Financial Network


Market Update for the Month Ending February 29, 2024

Presented by Mark Gallagher

Quick Hits

  1. Stocks Rally in February
  2. Challenging Month for Bonds
  3. Economy Continues to Expand
  4. Markets Updating Expectations for the Fed
  5. Real Risks Remain
  6. Solid Backdrop for Growth


Stocks Rally in February

February was a good month for stocks, with all three major U.S. indices ending the month in positive territory. The S&P 500 gained 5.34 percent in February while the Dow Jones Industrial Average rose by 2.50 percent. The Nasdaq Composite saw the largest gains during the month, with the technology-heavy index up more than 6.22 percent. Technology stocks rallied notably in February, due in part to increased investor optimism surrounding the potential for artificial intelligence-related investments.

The strong returns in February were supported by improving fundamentals. Per Bloomberg Intelligence as of February 29, with 97 percent of companies having reported actual earnings, the average earnings growth rate for the S&P 500 in the fourth quarter stood at 7.9 percent. This is well above analyst estimates at the start of earnings season for a more modest 1.2 percent increase. These impressive results were driven by better-than-expected earnings growth across most sectors, with the technology and consumer discretionary sectors seeing some of the best relative earnings growth during the quarter. Over the long run fundamental factors drive market performance, so the return to strong earnings growth in the fourth quarter is a good sign for investors.

Technical factors were also supportive during the month. All three major U.S. indices spent the entire month above their respective 200-day moving averages. This now marks four consecutive months with technical support for U.S. stocks. The 200-day moving average is a widely monitored technical signal, as prolonged breaks above or below this level can signal shifting investor sentiment for an index. The combination of improving fundamental factors and continued technical support is an encouraging tailwind for U.S. stocks to start the year.

The story was similar internationally, with both developed and emerging markets showing positive returns for the month. The MSCI EAFE Index gained 1.83 percent in February. Emerging Markets fared even better, with the MSCI Emerging Markets Index up 4.77 percent. Technical factors were also supportive, with both indices finishing the month above their respective 200-day moving averages. This was a return to technical support for the MSCI Emerging Markets Index, which previously ended January below
its trendline.

Challenging Month for Bonds

It was a challenging month for fixed-income investors, as rising interest rates weighed on higher-quality bond prices. The 10-year U.S. Treasury Yield rose from 3.99 percent at the end of January to
4.25 percent at the end of February. The Bloomberg Aggregate Bond Index lost 1.41 percent during the month due to the rising interest rate environment.

High-yield bonds, which are typically less influenced by interest rates, managed to end the month in positive territory. The Bloomberg U.S. Corporate High Yield Bond Index gained 0.29 percent during the month. High-yield credit spreads fell from 3.59 percent at the end of January to 3.29 percent at the end of February. Falling high-yield spreads are a sign that investors were willing to accept lower yields during the month when investing in riskier portions of the credit market.

Economy Continues to Expand

The economic updates released in February showed continued growth throughout the economy. Job growth accelerated to start the year, with an impressive 353,000 jobs added in January against calls for a more modest 185,000. This marked the largest monthly increase in hiring in more than a year and highlights the continued strength of the labor market. Consumer income and spending also continued to grow in the new year, with personal income growth coming in above expectations while personal spending rose in January for the 10th consecutive month.

Business confidence and spending also showed signs of improvement during the month. Manufacturing and service sector confidence both increased by more than expected in January, with service sector confidence rising to a four-month high to start the year. Historically higher levels of business confidence have supported faster spending growth, so these improvements were a welcome development.

While the economic updates were largely positive in February, the stronger-than-expected growth also contributed to still high levels of inflation. The January inflation reports showed that inflationary pressure rose during the month, with headline consumer prices rising by 0.3 percent in January. This marks the largest monthly increase in consumer prices since September—with a similar rise in producer prices during the month. On a year-over-year basis, headline consumer inflation did slow modestly, as you can see in Figure 1; however, inflation remains well above the Federal Reserve’s (FED) stated 2 percent target.


The Takeaway

– Economic growth continued in January, with impressive hiring and consistent personal spending growth during the month.

– Improved business confidence is a good sign for future business investment.

– Inflation remained stubbornly high at the start of the year, signaling continued work required to meet the Fed’s 2 percent target.

Markets Updating Expectations for the Fed

While there were no Fed meetings in February, markets continued to digest the messaging from the Fed’s most recent meeting at the end of January along with the economic updates that we received during the month. This caused investors to adjust their expectations for the Fed notably during the month. We started 2024 with futures markets pricing in a total of six interest rate cuts throughout the year. Investors believed that the Fed would cut rates early and often in 2024, with estimates calling for the first rate cut at the Fed’s March meeting.

Since then, we’ve seen stronger-than-expected job growth and stubbornly high inflation updates, both of which have caused investors and economists to rethink their expectations for the Fed. We ended the month with markets pricing in a total of just three interest rate cuts throughout the year, which is more in line with guidance from the Fed. This adjustment was one of the major drivers of the rise in interest rates that we saw in February.

Going forward, the timing and number of interest rate cuts this year remains uncertain. That said, the pullback in market expectations for cuts is a positive development as there is now less chance for future market disappointments when it comes to rate cuts.

The Takeaway

– Strong hiring growth and stubbornly high inflation in January caused investors to lower expectations for rate cuts throughout the year.

– The pullback in rate cut expectations is a positive development that may limit future volatility.

Real Risks Remain

While risks surrounding the Fed appear to have declined during the month, there are also other risks for investors that should be monitored as we look toward the rest of the year. The upcoming federal elections in November are a potential source of uncertainty that may weigh more heavily on markets as
they approach.

Globally, several risks remain as well, highlighted by ongoing tensions in the Middle East. While the direct market impact from the conflicts in Gaza and the Red Sea remains largely muted for now, they could negatively impact global supply chains and put additional stress on international shipping and prices if we see further escalation in the region.

The conflict in Ukraine is also worth monitoring due to the potential for further uncertainty, as is the continuing slowdown in China. Again, the current market impact from both risk factors is relatively low at this time; however, either could serve as a source of volatility for markets.

Ultimately there are several real risks for investors that should be acknowledged and monitored. Of course, there is also the potential for unknown risks to materialize and negatively impact markets.

The Takeaway

– Domestic and foreign risks remain for markets and investors.

– Unknown risks may also present themselves throughout the year.

Solid Backdrop for Growth 

Despite the risks that markets and investors face, the overall economic and market backdrop remains healthy and supportive for continued growth. The economic fundamentals remain sound, with positive updates at the start of the year highlighting the resilience of the current economic expansion. The strong earnings growth at the end of 2023 is an encouraging sign that businesses continue to benefit from the solid economic background, with signs that momentum from the end of last year has carried over into
this year.

While there are real risks for markets as we look ahead, it’s important to recognize that we’ve seen and overcome similar risks in the past. The pullback in market expectations for Fed rate cuts is a healthy development that we believe should set up markets for a smoother ride throughout the year. Additionally, while we saw a modest rise in inflation in January, overall, we’ve seen inflation fall notably over the past two years, with further improvements expected ahead.

After a strong end to 2023, the economic and market momentum has carried over into 2024, which is a good sign for investors. The potential for short-term setbacks remains given the uncertainty that we still face both domestically and abroad. As such, a well-diversified portfolio* that aligns investor goals with timelines remains the best path forward for most. As always, you should reach out to your financial advisor to discuss your current plan if you have concerns.

* Diversification does not assure a profit or protect against loss in declining markets, and diversification cannot guarantee that any objective or goal will be achieved


Disclosure: This material is intended for informational/educational purposes only and should not be construed as investment advice, a solicitation, or a recommendation to buy or sell any security or investment product. Please contact your financial professional for more information specific to your situation.

Certain sections of this commentary contain forward-looking statements based on our reasonable expectations, estimates, projections, and assumptions. Forward-looking statements are not guarantees of future performance and involve certain risks and uncertainties, which are difficult to predict. Past performance is not indicative of future results. Diversification does not assure a profit or protect against loss in declining markets. All indices are unmanaged and investors cannot invest directly into an index. The Dow Jones Industrial Average is a price-weighted average of 30 actively traded blue-chip stocks. The S&P 500 Index is a broad-based measurement of changes in stock market conditions based on the average performance of 500 widely held common stocks. The Nasdaq Composite Index measures the performance of all issues listed in the Nasdaq Stock Market, except for rights, warrants, units, and convertible debentures. The MSCI EAFE Index is a float-adjusted market capitalization index designed to measure developed market equity performance, excluding the U.S. and Canada. The MSCI Emerging Markets Index is a market capitalization-weighted index composed of companies representative of the market structure of 26 emerging market countries in Europe, Latin America, and the Pacific Basin. It excludes closed markets and those shares in otherwise free markets that are not purchasable by foreigners. The Bloomberg Aggregate Bond Index is an unmanaged market value-weighted index representing securities that are SEC-registered, taxable, and dollar-denominated. It covers the U.S. investment-grade fixed-rate bond market, with index components for a combination of the Bloomberg government and corporate securities, mortgage-backed pass-through securities, and asset-backed securities. The Bloomberg U.S. Corporate High Yield Index covers the USD-denominated, non-investment-grade, fixed-rate, taxable corporate bond market. Securities are classified as high-yield if the middle rating of Moody’s, Fitch, and S&P is Ba1/BB+/BB+ or below.

Mark Gallagher is a financial advisor located at Gallagher Financial Services at 2586 East 7th Ave. Suite #304, North Saint Paul, MN 55109. He offers securities and advisory services as an Investment Adviser Representative of Commonwealth Financial Network®, Member FINRA/SIPC, a Registered Investment Adviser. He can be reached at 651-774-8759 or at mark@markgallagher.com

Authored by the Investment Research team at Commonwealth Financial Network.

© 2024 Commonwealth Financial Network

Weekly Market Update March 4, 2024

Presented by Mark Gallagher

The rally in artificial intelligence (AI) continued last week as Dell posted strong earnings as demand for its AI servers rose. Bond investors bought between 2-year and 10-year maturities as the Federal Reserve’s (Fed’s) inflation gauge came in line with expectations.

Quick Hits

  1. Report releases: Personal income and spending increased in January.
  2. Financial market data: The AI rally picked up breadth as Dell and Super Micro Computer gained traction.
  3. Looking ahead: All eyes will be on employment data, with job openings and February’s employment report scheduled for release.

Keep reading for an in-depth look.

Report Releases—February 26–March 1, 2024

Preliminary Durable Goods Orders: January (Tuesday)

Headline durable goods orders missed expectations, due in part to a slowdown in volatile transportation orders. Core durable goods orders also slowed to start the year, signaling slowing business investment.

– Expected/prior durable goods orders monthly change: –5%/–0.3%

– Actual durable goods orders change: –6.1%

– Expected/prior core durable goods orders monthly change: +0.2%/–0.1%

– Actual core durable goods orders change: –0.3%

Conference Board Consumer Confidence Index: February (Tuesday)

Consumer confidence fell notably after rising more than expected in January. The pullback was caused primarily by souring consumer views on current economic conditions.

– Expected/prior month consumer confidence: 115/110.9

– Actual consumer confidence: 106.7

Personal Spending and Personal Income: January (Thursday).

Personal income and spending continued to rise in January, marking 10 consecutive months with personal spending growth.

– Expected/prior personal income monthly change: +0.4%/+0.3%

– Actual personal income change: +1%

– Expected/prior personal spending monthly change: +0.2%/+0.7%

– Actual personal spending change: +0.2%

ISM Manufacturing Index: February (Friday)
Manufacturer confidence fell more than expected, caused by slowing employment and new order growth.

– Expected/prior ISM Manufacturing index: 49.5/49.1

– Actual ISM Manufacturing index: 47.8

The Takeaway

– Consumer confidence fell in February despite rising personal income and spending in January.

– Manufacturing confidence fell more than expected in February.

Financial Market Data – Equity

Index Week-to-Date Month-to-Date Year-to-Date 12-Month
S&P 500 0.99% 0.81% 7.97% 31.11%
Nasdaq Composite 1.76% 1.14% 8.55% 43.12%
DJIA 0.00% 0.24% 4.09% 20.97%
MSCI EAFE 0.72% 0.79% 3.23% 15.36%
MSCI Emerging Markets –0.30% 0.38% 0.27% 7.35%
Russell 2000 3.00% 1.06% 2.62% 10.86%

Source: Bloomberg, as of March 1, 2024

Small-caps fared well on the heels of the AI rally. The face of this performance was Super Micro Computer, which focuses on AI server solutions. (The Dow Jones announced Super Micro Computer would be added to the S&P 500 as part of its quarterly rebalance.) Dell had better-than-expected earnings as it benefited from the move to AI-integrated servers. Health care, utilities, and staples struggled.

Fixed Income

Index Month-to-Date Year-to-Date 12-Month
U.S. Broad Market 0.39% –1.30% 4.65%
U.S. Treasury 0.38% –1.22% 3.50%
U.S. Mortgages 0.42% –1.67% 3.95%
Municipal Bond 0.01% –0.37% 5.70%

Source: Bloomberg, as of March 1, 2024

Treasuries rallied in the belly of the curve between 2-year and 10-year maturities. The release of the Fed’s preferred inflation gauge, the core Personal Consumption Expenditures (core PCE) Price Index, showed inflation in line with expectations, reinforcing confidence for bond investors. The 5-year yield fell almost 13 basis points (bps).

The Takeaway

– AI servers rallied and saw participation from large- and small-caps.

– Bond investors had renewed confidence in buying the belly of the curve after a key inflation report was in line with expectations.

Looking Ahead

This week, we expect several important economic data releases, including reports on service sector confidence, trade balance, and employment.

– On Tuesday, the ISM Services index for February is expected to be released. Service sector confidence is set to fall modestly after reaching a four-month high in January.

– On Wednesday, the Job Openings and Labor Turnover Survey (JOLTS) report will be released. It should provide information on labor market tightening and employee confidence.

– The January trade balance report is due Thursday. The international trade deficit is expected to increase modestly; the advance estimate for the trade of goods showed a widening trade gap.

– Finally, Friday will wrap with the February employment report. Hiring growth is expected to slow after surging more than expected in January. Nonetheless, economists still expect to see that a solid 188,000 jobs were added during the month.


Disclosures: This material is intended for informational/educational purposes only and should not be construed as investment advice, a solicitation, or a recommendation to buy or sell any security or investment product. Please contact your financial professional for more information specific to your situation.

Certain sections of this commentary contain forward-looking statements that are based on our reasonable expectations, estimates, projections, and assumptions. Forward-looking statements are not guarantees of future performance and involve certain risks and uncertainties, which are difficult to predict. All indices are unmanaged and are not available for direct investment by the public. Past performance is not indicative of future results. The S&P 500 is based on the average performance of the 500 industrial stocks monitored by Standard & Poor’s. The Nasdaq Composite Index measures the performance of all issues listed in the Nasdaq Stock Market, except for rights, warrants, units, and convertible debentures. The Dow Jones Industrial Average is computed by summing the prices of the stocks of 30 large companies and then dividing that total by an adjusted value, one which has been adjusted over the years to account for the effects of stock splits on the prices of the 30 companies. Dividends are reinvested to reflect the actual performance of the underlying securities. The MSCI EAFE Index is a float-adjusted market capitalization index designed to measure developed market equity performance, excluding the U.S. and Canada. The MSCI Emerging Markets Index is a market capitalization-weighted index composed of companies representative of the market structure of 26 emerging market countries in Europe, Latin America, and the Pacific Basin. The Russell 2000® Index measures the performance of the 2,000 smallest companies in the Russell 3000® Index. The Bloomberg US Aggregate Bond Index is an unmanaged market value-weighted performance benchmark for investment-grade fixed-rate debt issues, including government, corporate, asset-backed, and mortgage-backed securities with maturities of at least one year. The U.S. Treasury Index is based on the auctions of U.S. Treasury bills, or on the U.S. Treasury’s daily yield curve. The Bloomberg US Mortgage Backed Securities (MBS) Index is an unmanaged market value-weighted index of 15- and 30-year fixed-rate securities backed by mortgage pools of the Government National Mortgage Association (GNMA), Federal National Mortgage Association (Fannie Mae), and the Federal Home Loan Mortgage Corporation (FHLMC), and balloon mortgages with fixed-rate coupons. The Bloomberg US Municipal Index includes investment-grade, tax-exempt, and fixed-rate bonds with long-term maturities (greater than 2 years) selected from issues larger than $50 million. One basis point is equal to 1/100th of 1 percent, or 0.01 percent.


Mark Gallagher is a financial advisor located at Gallagher Financial Services at 2586 East 7th Ave. Suite #304, North Saint Paul, MN 55109. He offers securities and advisory services as an Investment Adviser Representative of Commonwealth Financial Network®, Member FINRA/SIPC, a Registered Investment Adviser. He can be reached at 651-774-8759 or at mark@markgallagher.com

Authored by the Investment Research team at Commonwealth Financial Network.

© 2024 Commonwealth Financial Network